Braceville: Fire Incidents, Illinois (IL)
Where are fire incidents reported in Braceville, IL
Something went wrong! Please refresh the page.
|
| |||||||||||||||||||||||||||||||||||||||||||||||||||||||||||||||||||||||||||||||||||||||||||||||||||||||||||||
2003 - 2018 National Fire Incident Reporting System (NFIRS) incidents
- Incident types reported to NFIRS in Braceville, IL
- 33251.4%Rescue & EMS
- 15724.3%Fire
- 589.0%Hazardous Condition
- 487.4%Good Intent Call
- 426.5%Service Call
- 40.6%False Alarm
- 30.5%Special Incident
- 10.2%Overpressure Rupture
- 10.2%Severe Weather
- Fire incident types reported to NFIRS in Braceville, IL
- 9862.4%Outside Fires
- 3622.9%Structure Fires
- 1912.1%Mobile Property/Vehicle Fires
- 42.5%Other
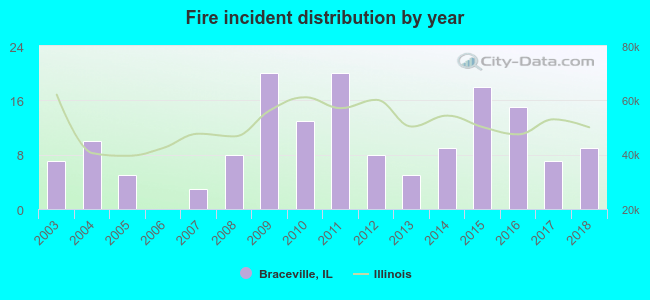 According to the data from the years 2003 - 2018 the average number of fire incidents per year is 10. The highest number of fire incidents - 20 took place in 2009, and the least - 0 in 2006. The data has an increasing trend.
 22.3% incidents where reported in the morning and 77.7% in the evening. The most fires (19.1%) took place on Friday, and the least (9.6%) on Wednesday.
 According to the 157 incident reports from years 2003 - 2018 most fires (22.3%) took place during March, and the least (2.5%) in January.
 Out of all 646 cases reported during the years 2003 - 2018, the most belonged to the categories: Rescue & EMS (51.4%), Fire (24.3%), and Hazardous Condition (9.0%).
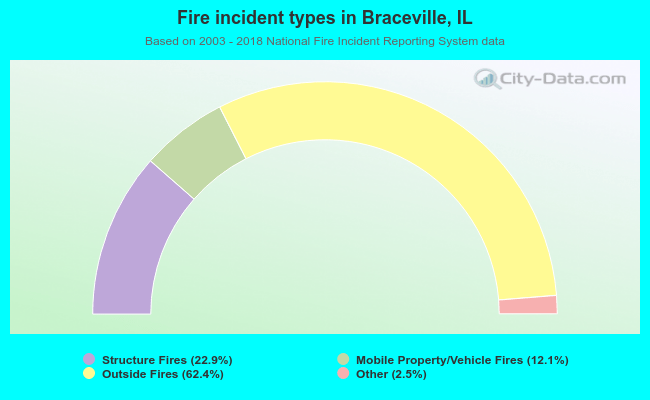 When looking into fire subcategories, the most reports belonged to: Outside Fires (62.4%), and Structure Fires (22.9%).