Bradley Beach: Fire Incidents, New Jersey (NJ)
Where are fire incidents reported in Bradley Beach, NJ
Something went wrong! Please refresh the page.
|
| |||||||||||||||||||||||||||||||||||||||||||||||||||||||||||||||||||||||||||||||||||||||||||||||||||||||||||||
2002 - 2018 National Fire Incident Reporting System (NFIRS) incidents
- Incident types reported to NFIRS in Bradley Beach, NJ
- 42239.7%Fire
- 26024.4%Hazardous Condition
- 26024.4%False Alarm
- 524.9%Service Call
- 343.2%Good Intent Call
- 282.6%Rescue & EMS
- 50.5%Severe Weather
- 20.2%Overpressure Rupture
- Fire incident types reported to NFIRS in Bradley Beach, NJ
- 36686.7%Structure Fires
- 307.1%Outside Fires
- 133.1%Mobile Property/Vehicle Fires
- 133.1%Other
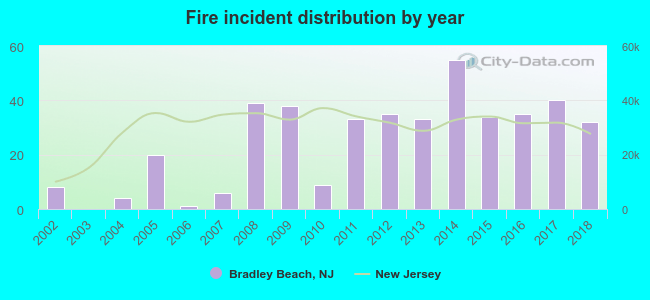 According to the data from the years 2002 - 2018 the average number of fires per year is 25. The highest number of reported fire incidents - 55 took place in 2014, and the least - 0 in 2003. The data has a growing trend.
 35.5% incidents where reported in the morning and 64.5% in the evening. The most fires (18.2%) took place on Sunday, and the least (11.6%) on Thursday.
 Based on the 422 fire incident reports from years 2002 - 2018 most fires (11.1%) took place during July, and the least (5.0%) in October.
 Out of all 1,064 cases reported during the years 2002 - 2018, the most belonged to the categories: Fire (39.7%), Hazardous Condition (24.4%), and False Alarm (24.4%).
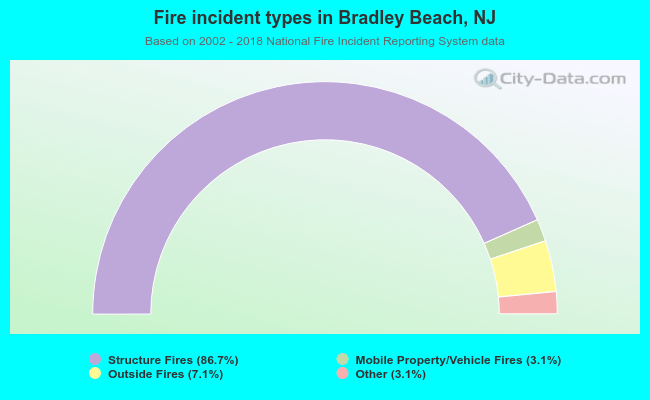 When looking into fire subcategories, the most reports belonged to: Structure Fires (86.7%), and Outside Fires (7.1%).