| Fire incidents reported |
|---|
| Sreet name | Count |
|---|
| COLBERT AVE | 16 | | COUNTY STREET 2970 | 12 | | CS 2970 | 8 | | TERRY AVE | 8 | | COUNTY ROAD 1490 | 6 | | COUNTY ROAD 1510 | 6 | | COUNTY STREET 2969 | 6 | | HIGHWAY 19 | 6 | | 4TH ST | 4 | | BRADLEY AVE | 4 | | COUNTY ROAD 1470 | 4 | | COUNTY STREET 2964 | 4 | | COUNTY STREET 2980 | 4 | | CR 1470 | 4 | | CS 2964 | 4 | | HIGHWAY 19 AND CR 1480 | 4 | | HWY 19 | 4 | | MAIN ST | 4 | | RIVER ROAD | 4 | | 1935 CR 1520 | 2 | | 2MISHWY 76 5MIW S INTO | 2 | | 308 COLBIRM | 2 | | 3173 CS 2970 | 2 | | 34 MILE W OF CL | 2 | | 4TH STREET | 2 |
| | | Fire incidents reported |
|---|
| Sreet name | Count |
|---|
| 5MI W 2MI S W INTO | 2 | | 5TH ST | 2 | | 6MIW/SHWY19/1.5W | 2 | | 6TH ST | 2 | | 6TH STREET | 2 | | 701 S MAIN | 2 | | 701 S. MAIN | 2 | | 7TH | 2 | | 7TH AND MAIN | 2 | | 7TH TERRY | 2 | | BROADWAY AVE | 2 | | COUNTY ROAD 1450 | 2 | | COUNTY ROAD 1560 | 2 | | CR 1440 | 2 | | CR 1490 | 2 | | CR 1520 | 2 | | E 7TH | 2 | | HWY 19 W | 2 | | HWY. 19 | 2 | | MAIN | 2 | | MAIN STREET | 2 | | MCGEE | 2 | | SE 51ST ST / CINDERELLA DR | 2 | | STATE HIGHWAY 19 | 2 | | |
|
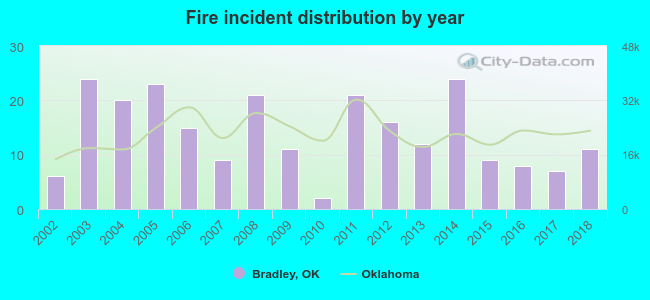 Based on the data from the years 2002 - 2018 the average number of fire incidents per year is 14. The highest number of fires - 24 took place in 2003, and the least - 2 in 2010. The data has an increasing trend.
 19.7% incidents where reported in the morning and 80.3% in the evening. The most fires (18.0%) took place on Friday, and the least (10.5%) on Saturday.
 Based on the 239 fire incident reports from years 2002 - 2018 most fires (15.1%) took place during March, and the least (4.2%) in October.
 Out of all 360 cases reported during the years 2002 - 2018, the most belonged to the categories: Fire (66.4%), Overpressure Rupture (20.0%), and Service Call (6.4%).
 When looking into fire subcategories, the most reports belonged to: Outside Fires (60.3%), and Structure Fires (18.0%).