Brandon: Fire Incidents, Vermont (VT)
Where are fire incidents reported in Brandon, VT
Something went wrong! Please refresh the page.
|
| |||||||||||||||||||||||||||||||||||||||||||||||||||||||||||||||||||||||||||||||||||||||||||||||||||||||||||||
| Other | 39 | |||||||||||||||||||||||||||||||||||||||||||||||||||||||||||||||||||||||||||||||||||||||||||||||||||||||||||||
2002 - 2018 National Fire Incident Reporting System (NFIRS) incidents
- Incident types reported to NFIRS in Brandon, VT
- 33134.4%Fire
- 28429.5%Hazardous Condition
- 13514.0%False Alarm
- 10911.3%Rescue & EMS
- 788.1%Good Intent Call
- 212.2%Service Call
- 20.2%Severe Weather
- 20.2%Special Incident
- 10.1%Overpressure Rupture
- Fire incident types reported to NFIRS in Brandon, VT
- 18355.3%Structure Fires
- 11334.1%Outside Fires
- 288.5%Mobile Property/Vehicle Fires
- 72.1%Other
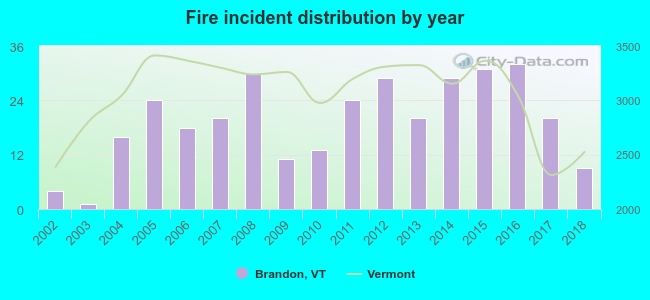 According to the data from the years 2002 - 2018 the average number of fires per year is 19. The highest number of fire incidents - 32 took place in 2016, and the least - 1 in 2003. The data has an increasing trend.
 28.1% incidents where reported in the morning and 71.9% in the evening. The most fires (20.5%) took place on Sunday, and the least (9.7%) on Wednesday.
 Based on the 331 reports from years 2002 - 2018 most fires (17.5%) took place during April, and the least (2.7%) in June.
 Out of all 963 cases reported during the years 2002 - 2018, the most belonged to the categories: Fire (34.4%), Hazardous Condition (29.5%), and False Alarm (14.0%).
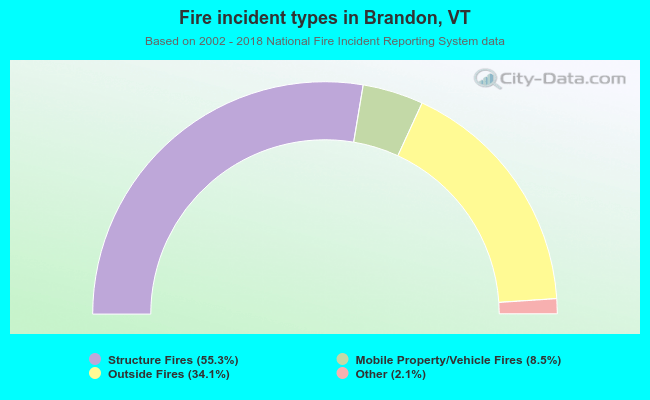 When looking into fire subcategories, the most incidents belonged to: Structure Fires (55.3%), and Outside Fires (34.1%).