Braselton: Fire Incidents, Georgia (GA)
Where are fire incidents reported in Braselton, GA
Something went wrong! Please refresh the page.
|
| |||||||||||||||||||||||||||||||||||||||||||||||||||||||||||||||||||||||||||||||||||||||||||||||||||||||||||||
2002 - 2018 National Fire Incident Reporting System (NFIRS) incidents
- Incident types reported to NFIRS in Braselton, GA
- 2,03057.0%Rescue & EMS
- 57416.1%Good Intent Call
- 43012.1%Fire
- 2186.1%Service Call
- 1584.4%False Alarm
- 1383.9%Hazardous Condition
- 80.2%Overpressure Rupture
- 70.2%Severe Weather
- Fire incident types reported to NFIRS in Braselton, GA
- 19244.7%Outside Fires
- 13932.3%Structure Fires
- 9822.8%Mobile Property/Vehicle Fires
- 10.2%Other
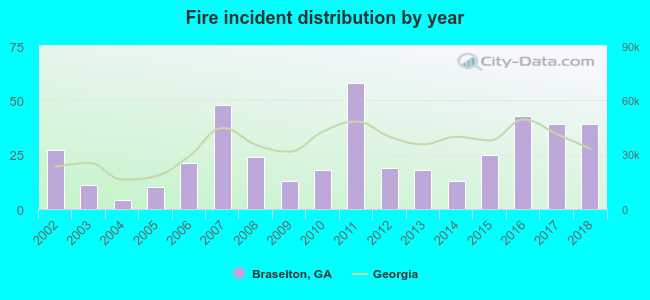 Based on the data from the years 2002 - 2018 the average number of fire incidents per year is 25. The highest number of reported fire incidents - 58 took place in 2011, and the least - 4 in 2004. The data has an increasing trend.
The average number of yearly fire incidents per 10k residents in Braselton, GA compared to nearest cities:
(Note: Based on data for the last 3 years, including only cities with population 5,000 and above)
| Braselton: | 46.2 |
| Auburn: | 68.5 |
| Winder: | 88.4 |
| Flowery Branch: | 122.7 |
| Buford: | 165.8 |
| Jefferson: | 133.8 |
| Sugar Hill: | 0.5 |
| Gainesville: | 129.7 |
| Lawrenceville: | 146.9 |

 According to the reports from the years 2002 - 2018 the average number of fire-related yearly casualties is 0. The highest number of reported injuries - 2 took place in 2011, and the lowest - 0 in 2002. The data has a constant trend.
 23.3% incidents where reported in the morning and 76.7% in the evening. The most fires (17.2%) took place on Sunday, and the least (10.9%) on Tuesday.
 According to the 430 fire incident reports from years 2002 - 2018 most fires (12.6%) took place during February, and the least (5.8%) in December.
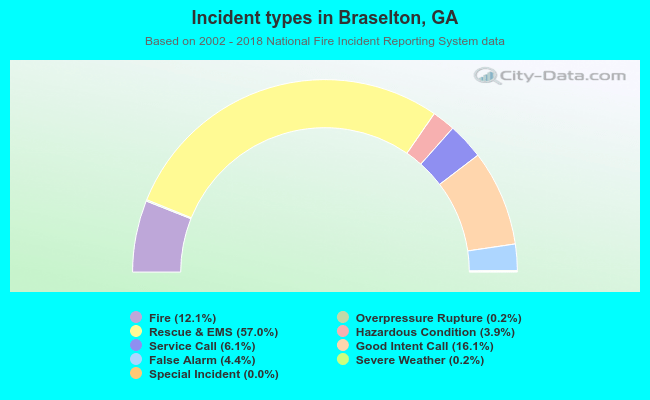 Out of all 3,564 cases reported during the years 2002 - 2018, the most belonged to the categories: Rescue & EMS (57.0%), Good Intent Call (16.1%), and Fire (12.1%).
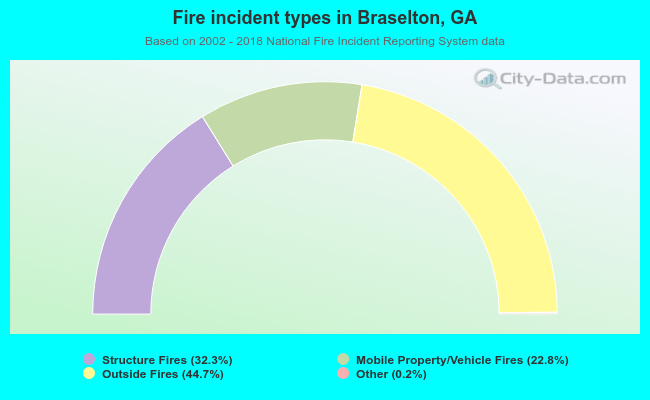 When looking into fire subcategories, the most incidents belonged to: Outside Fires (44.7%), and Structure Fires (32.3%).