Brentwood: Fire Incidents, Tennessee (TN)
Where are fire incidents reported in Brentwood, TN
Something went wrong! Please refresh the page.
| Fire incidents reported | |
|---|---|
| Sreet name | Count |
| INTERSTATE 65 | 172 |
| FRANKLIN RD | 166 |
| CONCORD RD | 70 |
| MOORES LN | 68 |
| MARYLAND WAY | 58 |
| MURRAY LN | 44 |
| OLD HICKORY BLVD | 40 |
| CHURCH ST | 38 |
| MALLORY LN | 34 |
| WILSON PKE | 28 |
| FRANKLIN ROAD | 24 |
| HOLLY TREE GAP RD | 24 |
| WARD CIR | 24 |
| I65 | 22 |
| WESTGATE CIR | 22 |
| FOUNTAINHEAD DR | 20 |
| MOORES LANE | 20 |
| CROCKETT RD | 18 |
| VIRGINIA WAY | 18 |
| WILLIAMSBURG RD | 18 |
| WILSON PIKE CIR | 18 |
| GOVERNORS WAY | 16 |
| WILSON PIKE | 16 |
| CONCORD ROAD | 14 |
| JONES PKWY | 14 |
| MURRAY LANE | 14 |
| OLD SMYRNA RD | 14 |
| WESTWOOD PL | 14 |
| WINNERS CIR | 14 |
| EASTPARK DR | 12 |
| Other | 381 |
2002 - 2018 National Fire Incident Reporting System (NFIRS) incidents
- Incident types reported to NFIRS in Brentwood, TN
- 11,28051.3%Rescue & EMS
- 3,76417.1%False Alarm
- 1,9638.9%Good Intent Call
- 1,8458.4%Hazardous Condition
- 1,5607.1%Service Call
- 1,4556.6%Fire
- 470.2%Special Incident
- 400.2%Severe Weather
- Fire incident types reported to NFIRS in Brentwood, TN
- 62943.2%Outside Fires
- 45231.1%Structure Fires
- 31721.8%Mobile Property/Vehicle Fires
- 573.9%Other
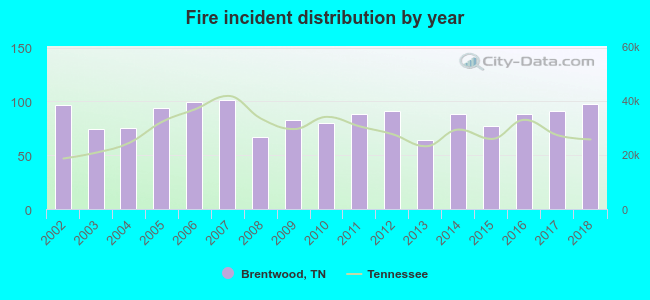 Based on the data from the years 2002 - 2018 the average number of fires per year is 86. The highest number of reported fire incidents - 101 took place in 2007, and the least - 64 in 2013. The data has an increasing trend.
The average number of yearly fire incidents per 10k residents in Brentwood, TN compared to nearest cities:
(Note: Based on data for the last 3 years, including only cities with population 5,000 and above)
| Brentwood: | 22.5 |
| Franklin: | 30.3 |
| Nolensville: | 35.8 |
| La Vergne: | 1.8 |
| Smyrna: | 37.8 |
| Spring Hill: | 17.9 |
| Fairview: | 28.4 |
| Mount Juliet: | 23.0 |
| Goodlettsville: | 52.6 |
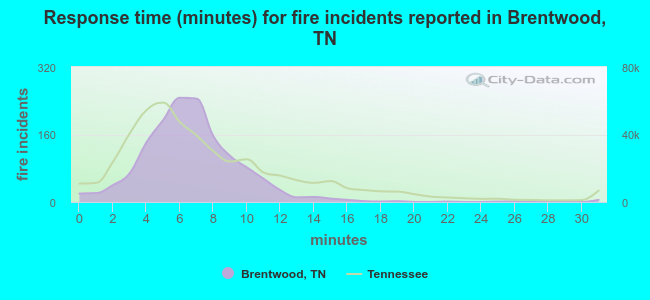 The median response time based on all reported fire incidents is 6 minutes. This is about the same as the state median value.
The median response time in Brentwood, TN compared to nearest cities:
(Note: Based on data for all years, including only cities with at least 500 fire incidents)
| Brentwood: | 6 minutes |
| Franklin: | 6 minutes |
| La Vergne: | 3 minutes |
| Smyrna: | 6 minutes |
| Spring Hill: | 6 minutes |
| Fairview: | 9 minutes |
| Mount Juliet: | 9 minutes |
| Goodlettsville: | 4 minutes |
| Hendersonville: | 5 minutes |
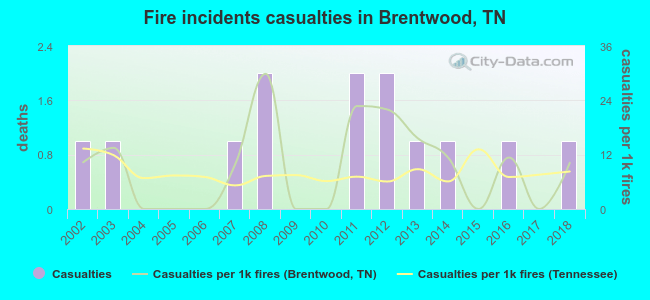 According to the data from the years 2002 - 2018 the average number of fire-related casualties per year is 1. The highest number of reported casualties - 2 took place in 2008, and the lowest - 0 in 2004. The data has a constant trend.
The average number of injuries per 1,000 fires is 9. This indicator was the highest - 30 in 2008, and the lowest 0 in 2004. The trend for injuries per 1,000 incidents is decreasing. Compared to the state value the number of casualties per 1,000 incidents is similar.
According to the data from the years 2002 - 2018 the average number of fire-related casualties per year is 1. The highest number of reported casualties - 2 took place in 2008, and the lowest - 0 in 2004. The data has a constant trend.
The average number of injuries per 1,000 fires is 9. This indicator was the highest - 30 in 2008, and the lowest 0 in 2004. The trend for injuries per 1,000 incidents is decreasing. Compared to the state value the number of casualties per 1,000 incidents is similar.Casualties per 1,000 incidents in Brentwood, TN compared to nearest cities:
(Note: Based on data for all years, including only cities with at least 500 fire incidents)
| Brentwood: | 8.9 |
| Franklin: | 12.8 |
| La Vergne: | 3.2 |
| Smyrna: | 48.9 |
| Spring Hill: | 3.6 |
| Fairview: | 5.4 |
| Mount Juliet: | 12.6 |
| Goodlettsville: | 7.5 |
| Hendersonville: | 30.0 |
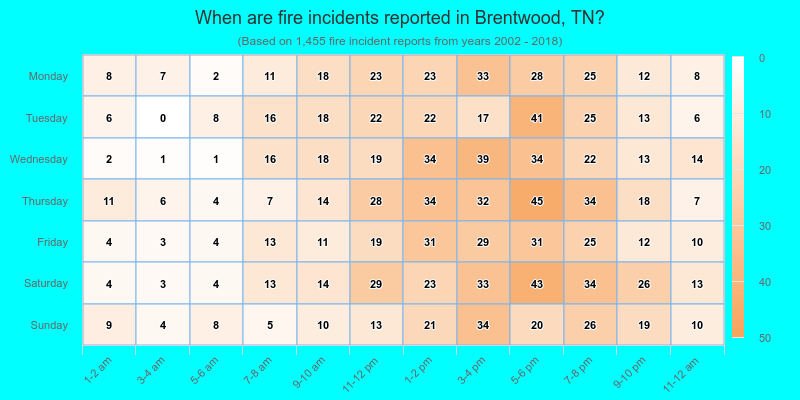
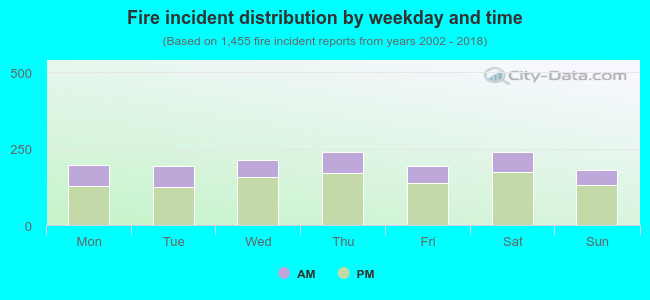 30.0% incidents where reported in the morning and 70.0% in the evening. The most fires (16.5%) took place on Thursday, and the least (12.3%) on Sunday.
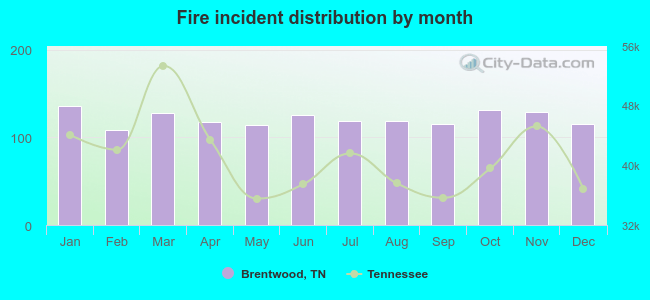 Based on the 1,455 fire incidents from years 2002 - 2018 most fires (9.3%) took place during January, and the least (7.4%) in February.
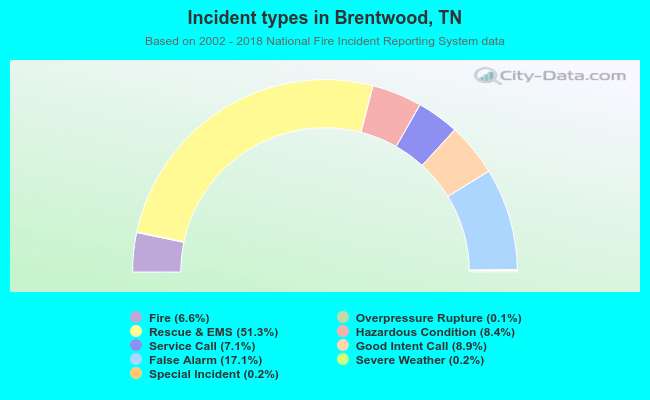 Out of all 21,975 cases reported during the years 2002 - 2018, the most belonged to the categories: Rescue & EMS (51.3%), False Alarm (17.1%), and Good Intent Call (8.9%).
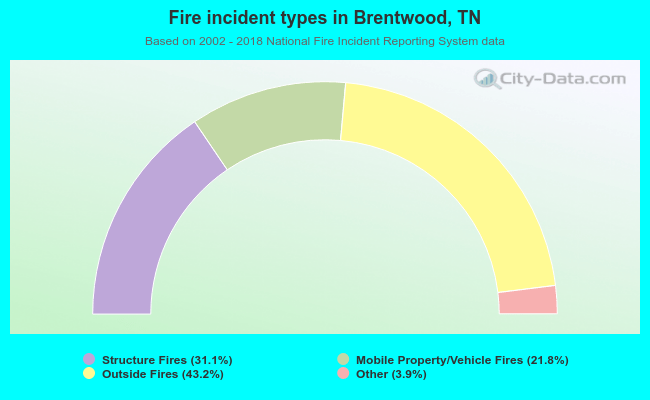 When looking into fire subcategories, the most incidents belonged to: Outside Fires (43.2%), and Structure Fires (31.1%).