Bridgeport: Fire Incidents, Nebraska (NE)
Where are fire incidents reported in Bridgeport, NE
Something went wrong! Please refresh the page.
|
| |||||||||||||||||||||||||||||||||||||||||||||||||||||||||||||||||||||||||||||||||||||||||||||||||||||||||||||
| Other | 109 | |||||||||||||||||||||||||||||||||||||||||||||||||||||||||||||||||||||||||||||||||||||||||||||||||||||||||||||
2002 - 2018 National Fire Incident Reporting System (NFIRS) incidents
- Incident types reported to NFIRS in Bridgeport, NE
- 23181.3%Fire
- 279.5%Good Intent Call
- 144.9%Rescue & EMS
- 62.1%Hazardous Condition
- 41.4%False Alarm
- 10.4%Overpressure Rupture
- 10.4%Service Call
- Fire incident types reported to NFIRS in Bridgeport, NE
- 14562.8%Outside Fires
- 4419.0%Structure Fires
- 3113.4%Mobile Property/Vehicle Fires
- 114.8%Other
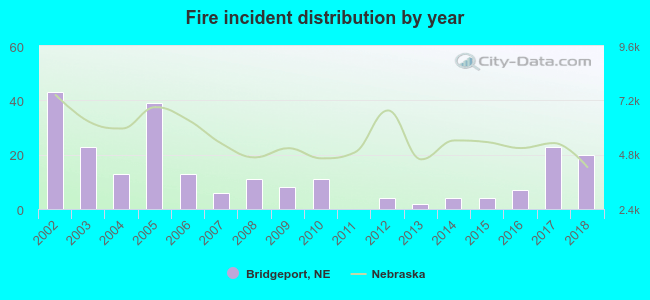 Based on the data from the years 2002 - 2018 the average number of fire incidents per year is 14. The highest number of fire incidents - 43 took place in 2002, and the least - 0 in 2011. The data has a decreasing trend.
 26.0% incidents where reported in the morning and 74.0% in the evening. The most fires (16.0%) took place on Wednesday, and the least (10.4%) on Saturday.
 According to the 231 incident reports from years 2002 - 2018 most fires (18.2%) took place during June, and the least (2.2%) in December.
 Out of all 284 cases reported during the years 2002 - 2018, the most belonged to the categories: Fire (81.3%), Good Intent Call (9.5%), and Rescue & EMS (4.9%).
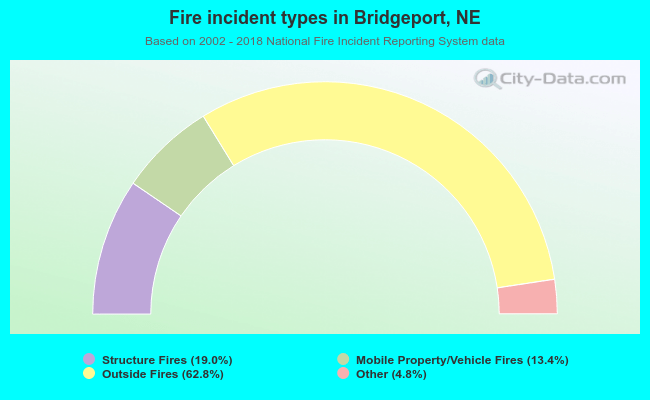 When looking into fire subcategories, the most reports belonged to: Outside Fires (62.8%), and Structure Fires (19.0%).