Bridgeport: Fire Incidents, Pennsylvania (PA)
Where are fire incidents reported in Bridgeport, PA
Something went wrong! Please refresh the page.
|
| |||||||||||||||||||||||||||||||||||||||||||||||||||||||||||||||||||||||||||||||||||||||||||||||||||||||||||||
2004 - 2018 National Fire Incident Reporting System (NFIRS) incidents
- Incident types reported to NFIRS in Bridgeport, PA
- 16429.5%Fire
- 13424.1%Hazardous Condition
- 12923.2%False Alarm
- 559.9%Good Intent Call
- 356.3%Rescue & EMS
- 325.8%Service Call
- 61.1%Special Incident
- Fire incident types reported to NFIRS in Bridgeport, PA
- 11067.1%Structure Fires
- 3823.2%Outside Fires
- 106.1%Mobile Property/Vehicle Fires
- 63.7%Other
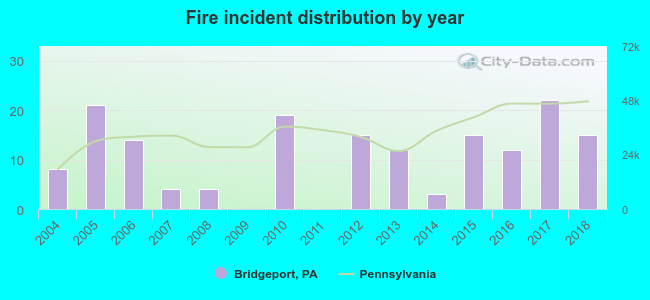 Based on the data from the years 2004 - 2018 the average number of fires per year is 11. The highest number of fire incidents - 22 took place in 2017, and the least - 0 in 2009. The data has a growing trend.
 34.1% incidents where reported in the morning and 65.9% in the evening. The most fires (17.7%) took place on Thursday, and the least (10.4%) on Tuesday.
 Based on the 164 incident reports from years 2004 - 2018 most fires (15.9%) took place during March, and the least (3.0%) in August.
 Out of all 555 cases reported during the years 2004 - 2018, the most belonged to the categories: Fire (29.5%), Rescue & EMS (24.1%), and Good Intent Call (23.2%).
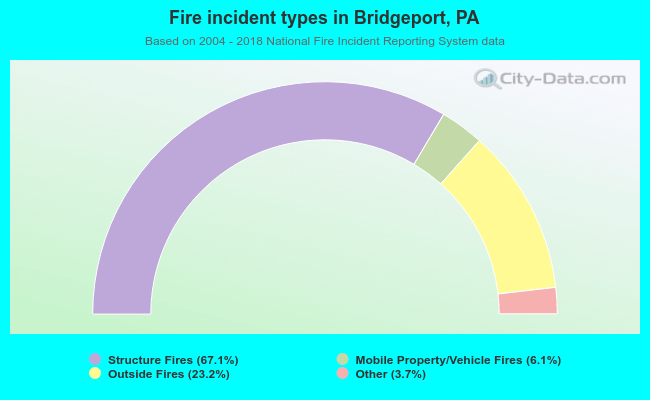 When looking into fire subcategories, the most reports belonged to: Structure Fires (67.1%), and Outside Fires (23.2%).