| Fire incidents reported |
|---|
| Sreet name | Count |
|---|
| HWY 183 | 66 | | FM 2657 | 28 | | CR 210 | 12 | | CR 211 | 6 | | CR 218 | 6 | | HWY 183 & CR 211 | 6 | | HWY 183, 1/2 MILE S OF MES. CR | 6 | | US 183 | 6 | | US 183 HWY | 6 | | WALKER ST | 6 | | 1070 CR 224 | 4 | | 300 BLK PEARL ST | 4 | | BLK CR 219 | 4 | | BLK FM 2657 | 4 | | COUNTY ROAD 218 RD | 4 | | CR 212 | 4 | | CR 224 | 4 | | FM 243 | 4 | | FM 243 AND CR 213 | 4 | | FM 963 | 4 | | HWY 183 & CR 209 | 4 | | HWY 183 HWY | 4 | | HWY 183, 2 MILES S OF BRIGGS | 4 | | HWY. 183 HWY | 4 | | LOOP 308 | 4 |
| | | Fire incidents reported |
|---|
| Sreet name | Count |
|---|
| 1 1/2MIN OF BRIGGS/HWY183 | 2 | | 1 BLOCK N CR219/FM2657 | 2 | | 1/2-3/4MIN.OF LOOP 308/FM2657 | 2 | | 1/4 MI.W OF HWY183 DILLINGHAM | 2 | | 1/4MIE HWY183/LOOP 308 | 2 | | 106 CR 229 | 2 | | 1087 MILL CREEK | 2 | | 111 CR 229 LGTS | 2 | | 111 CR 229/DILLINGHAM LOOP | 2 | | 1117 SPRING CREEK RD | 2 | | 11805 US HWY 183 | 2 | | 1217 SPRING CREEK ROAD | 2 | | 1330 MILL CREEK ROAD | 2 | | 1350 G BAR M ROAD | 2 | | 1580 COUNTY ROAD 220 ROAD | 2 | | 1618 & 2500 FM 2657 | 2 | | 1619 FM 2657 | 2 | | 183 & CR 208 | 2 | | 183 & CR 209 | 2 | | 183 & CR 211 | 2 | | 183 & CR 218 | 2 | | 183 CR 209 | 2 | | 183 CR 209B | 2 | | 1906 CR 210 | 2 | | |
|
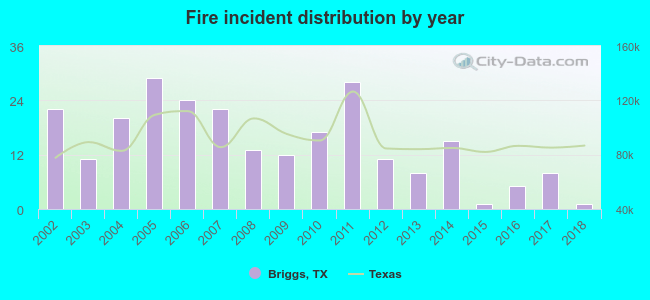 According to the data from the years 2002 - 2018 the average number of fire incidents per year is 15. The highest number of fire incidents - 29 took place in 2005, and the least - 1 in 2015. The data has a declining trend.
 21.9% incidents where reported in the morning and 78.1% in the evening. The most fires (19.4%) took place on Sunday, and the least (10.9%) on Wednesday.
 Based on the 247 fires from years 2002 - 2018 most fires (13.0%) took place during January, and the least (5.7%) in March.
 Out of all 733 cases reported during the years 2002 - 2018, the most belonged to the categories: Overpressure Rupture (36.4%), Fire (33.7%), and Rescue & EMS (15.3%).
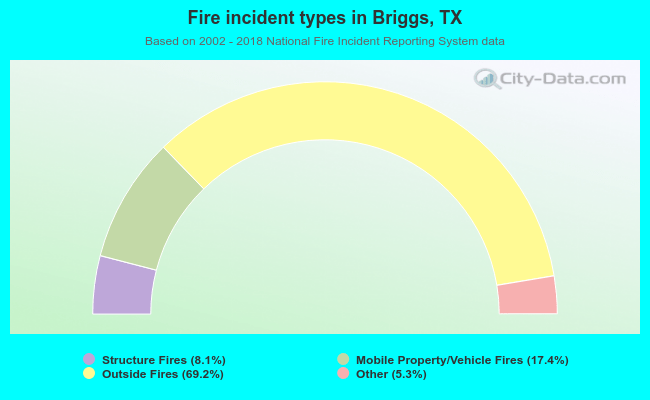 When looking into fire subcategories, the most incidents belonged to: Outside Fires (69.2%), and Mobile Property/Vehicle Fires (17.4%).