Britt: Fire Incidents, Iowa (IA)
Where are fire incidents reported in Britt, IA
Something went wrong! Please refresh the page.
|
| |||||||||||||||||||||||||||||||||||||||||||||||||||||||||||||||||||||||||||||||||||||||||||||||||||||||||||||
2002 - 2017 National Fire Incident Reporting System (NFIRS) incidents
- Incident types reported to NFIRS in Britt, IA
- 16046.4%Fire
- 8725.2%Rescue & EMS
- 4111.9%Good Intent Call
- 267.5%Hazardous Condition
- 154.3%False Alarm
- 113.2%Severe Weather
- 51.4%Service Call
- Fire incident types reported to NFIRS in Britt, IA
- 6339.4%Outside Fires
- 5131.9%Structure Fires
- 3220.0%Mobile Property/Vehicle Fires
- 148.8%Other
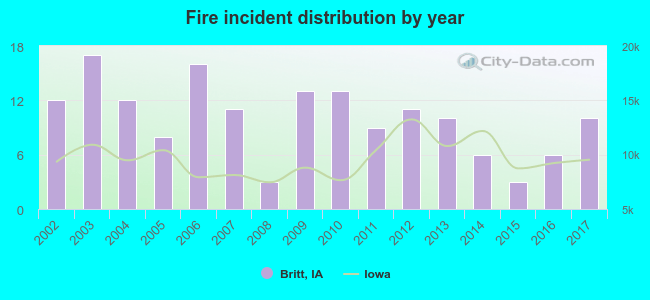 According to the data from the years 2002 - 2017 the average number of fire incidents per year is 10. The highest number of reported fire incidents - 17 took place in 2003, and the least - 3 in 2008. The data has a decreasing trend.
 According to the data from the years 2002 - 2017 the average number of fire-related yearly casualties is 1. The highest number of injuries - 5 took place in 2017, and the lowest - 0 in 2002. The data has a rising trend.
 28.8% incidents where reported in the morning and 71.3% in the evening. The most fires (21.3%) took place on Monday, and the least (8.8%) on Friday.
 According to the 160 fire incidents from years 2002 - 2017 most fires (16.3%) took place during April, and the least (4.4%) in September.
 Out of all 345 cases reported during the years 2002 - 2017, the most belonged to the categories: Fire (46.4%), Overpressure Rupture (25.2%), and Service Call (11.9%).
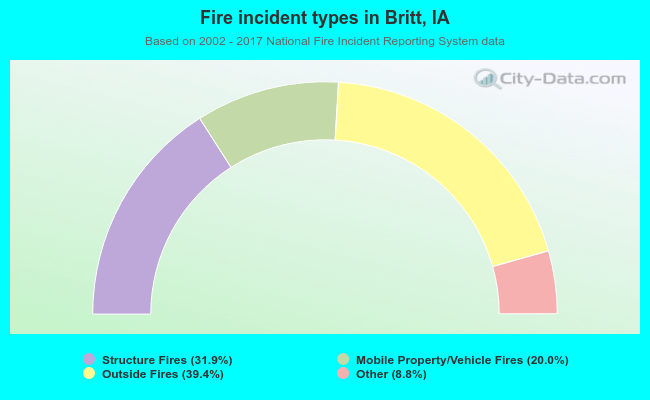 When looking into fire subcategories, the most reports belonged to: Outside Fires (39.4%), and Structure Fires (31.9%).