Broken Bow: Fire Incidents, Nebraska (NE)
Where are fire incidents reported in Broken Bow, NE
Something went wrong! Please refresh the page.
|
| |||||||||||||||||||||||||||||||||||||||||||||||||||||||||||||||||||||||||||||||||||||||||||||||||||||||||||||
| Other | 121 | |||||||||||||||||||||||||||||||||||||||||||||||||||||||||||||||||||||||||||||||||||||||||||||||||||||||||||||
2002 - 2018 National Fire Incident Reporting System (NFIRS) incidents
- Incident types reported to NFIRS in Broken Bow, NE
- 25964.3%Fire
- 4811.9%Hazardous Condition
- 399.7%Rescue & EMS
- 235.7%Good Intent Call
- 164.0%Service Call
- 123.0%False Alarm
- 30.7%Severe Weather
- 20.5%Special Incident
- 10.2%Overpressure Rupture
- Fire incident types reported to NFIRS in Broken Bow, NE
- 11945.9%Outside Fires
- 6525.1%Structure Fires
- 5922.8%Mobile Property/Vehicle Fires
- 166.2%Other
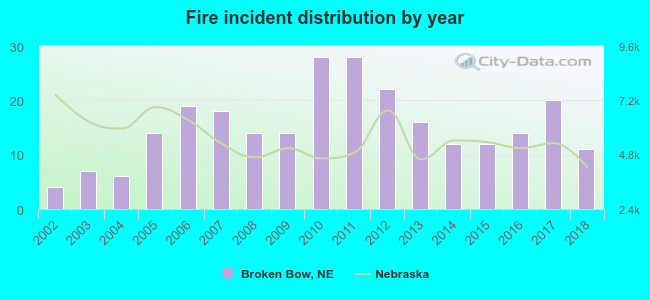 Based on the data from the years 2002 - 2018 the average number of fire incidents per year is 15. The highest number of fire incidents - 28 took place in 2010, and the least - 4 in 2002. The data has an increasing trend.
 24.3% incidents where reported in the morning and 75.7% in the evening. The most fires (19.3%) took place on Sunday, and the least (11.2%) on Friday.
 According to the 259 incident reports from years 2002 - 2018 most fires (13.9%) took place during July, and the least (5.0%) in May.
 Out of all 403 cases reported during the years 2002 - 2018, the most belonged to the categories: Fire (64.3%), Hazardous Condition (11.9%), and Rescue & EMS (9.7%).
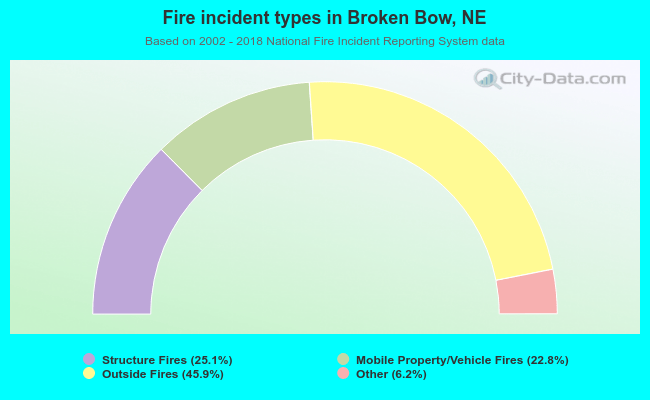 When looking into fire subcategories, the most reports belonged to: Outside Fires (45.9%), and Structure Fires (25.1%).