| Fire incidents reported |
|---|
| Sreet name | Count |
|---|
| CHICAGOBATAVIA TWP RD | 16 | | CHICAGOBRONSON TWP RD | 12 | | PARHAM RD | 12 | | ADAMSGILEAD TWP RD | 8 | | BABCOCKMATTESON TWP RD | 8 | | CHICAGO RD | 8 | | LILLYNOBLE TWP RD | 8 | | SOUTHERNGILEAD TWP RD | 8 | | CENTRALBETHEL TWP RD | 6 | | CHICAGOBRONSON CITY ST | 6 | | COLONBATAVIA TWP RD | 6 | | GEORGENOBLE TWP RD | 6 | | HOLLOW RD | 6 | | HOLLOWBRONSON TWP RD | 6 | | KOSMERICKBETHEL TWP RD | 6 | | LLOYD(MATTESON TWP) LN | 6 | | MATTESON LAKEMATTESON TWP RD | 6 | | SLISHER RD | 6 | | BABCOCK RD | 4 | | BAWDEN RD | 4 | | BLOCK RD | 4 | | BLOCKGILEAD TWP RD | 4 | | BUCHANANBRONSON CITY ST | 4 | | CHICAGO(BETHEL TWP) RD | 4 | | COLON RD | 4 |
| | | Fire incidents reported |
|---|
| Sreet name | Count |
|---|
| COLONMATTESON TWP RD | 4 | | CRANSONBETHEL TWP RD | 4 | | CULVERMATTESON TWP RD | 4 | | DEER PARKBRONSON TWP RD | 4 | | HUBBARD RD | 4 | | JACKSONMATTESON TWP RD | 4 | | KIBILOSKI RD | 4 | | LILLY RD | 4 | | MATTESON LAKE RD | 4 | | MATTESON ST | 4 | | NASHBATAVIA TWP | 4 | | NASHBATAVIA TWP RD | 4 | | ORLANDNOBLE TWP RD | 4 | | PARHAMBETHEL TWP RD | 4 | | PEARLBETHEL TWP RD | 4 | | PRAIRIE RIVERBRONSON TWP RD | 4 | | RAILROAD(BRONSON CITY) | 4 | | RIERSONNOBLE TWP RD | 4 | | RUBLEYGILEAD TWP RD | 4 | | SIELKENSNOBLE TWP RD | 4 | | SIMS(GILEAD TWP) RD | 4 | | SLISHERGILEAD TWP RD | 4 | | SNOW PRAIRIE RD | 4 | | SOUTHERN RD | 4 | | TAGGARTBRONSON TWP RD | 4 |
|
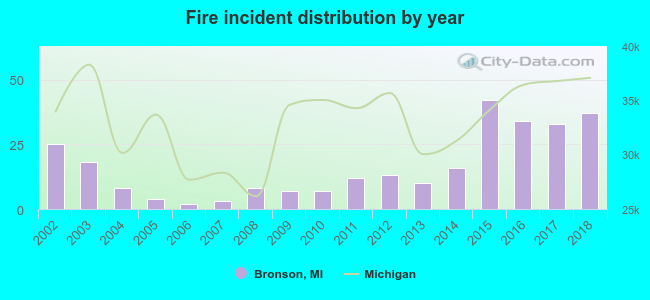 According to the data from the years 2002 - 2018 the average number of fire incidents per year is 16. The highest number of reported fires - 42 took place in 2015, and the least - 2 in 2006. The data has an increasing trend.
 Based on the data from the years 2002 - 2018 the average number of fire-related yearly deaths is 0. The highest number of reported deaths - 2 took place in 2018, and the lowest - 0 in 2002. The data has a rising trend.
 Based on the data from the years 2002 - 2018 the average number of fire-related casualties per year is 0. The highest number of reported injuries - 3 took place in 2017, and the lowest - 0 in 2004. The data has a constant trend.
 30.5% incidents where reported in the morning and 69.5% in the evening. The most fires (17.9%) took place on Sunday, and the least (11.1%) on Monday.
 Based on the 279 fires from years 2002 - 2018 most fires (14.3%) took place during March, and the least (3.2%) in February.
 Out of all 1,227 cases reported during the years 2002 - 2018, the most belonged to the categories: Rescue & EMS (50.7%), Fire (22.7%), and Hazardous Condition (13.3%).
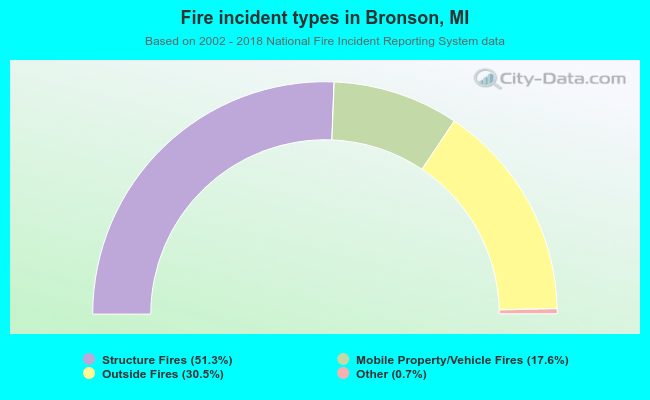 When looking into fire subcategories, the most incidents belonged to: Structure Fires (51.3%), and Outside Fires (30.5%).