Brooklyn: Fire Incidents, Illinois (IL)
Where are fire incidents reported in Brooklyn, IL
Something went wrong! Please refresh the page.
|
| |||||||||||||||||||||||||||||||||||||||||||||||||||||||||||||||||||||||||||||||||||||||||||||||||||||||||||||
2002 - 2018 National Fire Incident Reporting System (NFIRS) incidents
- Incident types reported to NFIRS in Brooklyn, IL
- 30364.1%Fire
- 5311.2%Rescue & EMS
- 347.2%Good Intent Call
- 296.1%Hazardous Condition
- 285.9%False Alarm
- 245.1%Service Call
- 20.4%Special Incident
- Fire incident types reported to NFIRS in Brooklyn, IL
- 22674.6%Structure Fires
- 4615.2%Outside Fires
- 216.9%Mobile Property/Vehicle Fires
- 103.3%Other
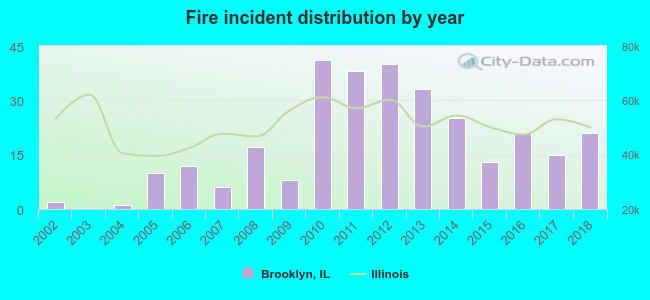 According to the data from the years 2002 - 2018 the average number of fires per year is 18. The highest number of fires - 41 took place in 2010, and the least - 0 in 2003. The data has a growing trend.
 45.5% incidents where reported in the morning and 54.5% in the evening. The most fires (22.4%) took place on Saturday, and the least (10.9%) on Sunday.
 Based on the 303 fire incident reports from years 2002 - 2018 most fires (15.8%) took place during January, and the least (4.3%) in December.
 Out of all 473 cases reported during the years 2002 - 2018, the most belonged to the categories: Fire (64.1%), Overpressure Rupture (11.2%), and Service Call (7.2%).
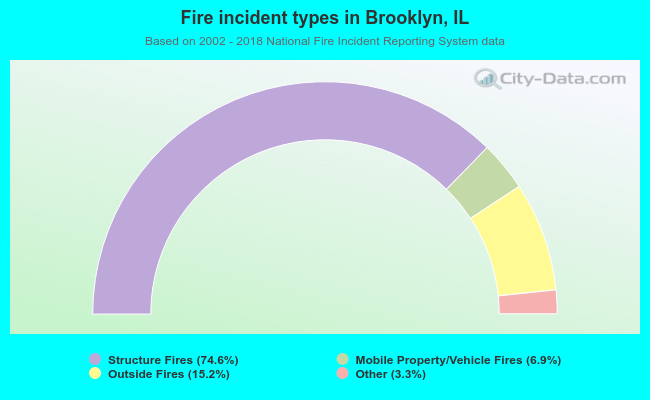 When looking into fire subcategories, the most reports belonged to: Structure Fires (74.6%), and Outside Fires (15.2%).