Brooklyn: Fire Incidents, New York (NY)
Where are fire incidents reported in Brooklyn, NY
Something went wrong! Please refresh the page.
|
| |||||||||||||||||||||||||||||||||||||||||||||||||||||||||||||||||||||||||||||||||||||||||||||||||||||||||||||
| Other | 43 | |||||||||||||||||||||||||||||||||||||||||||||||||||||||||||||||||||||||||||||||||||||||||||||||||||||||||||||
2003 - 2012 National Fire Incident Reporting System (NFIRS) incidents
- Incident types reported to NFIRS in Brooklyn, NY
- 23580.8%Fire
- 3110.7%Rescue & EMS
- 113.8%Hazardous Condition
- 62.1%Service Call
- 41.4%False Alarm
- 31.0%Good Intent Call
- 10.3%Overpressure Rupture
- Fire incident types reported to NFIRS in Brooklyn, NY
- 18478.3%Structure Fires
- 3213.6%Mobile Property/Vehicle Fires
- 135.5%Outside Fires
- 62.6%Other
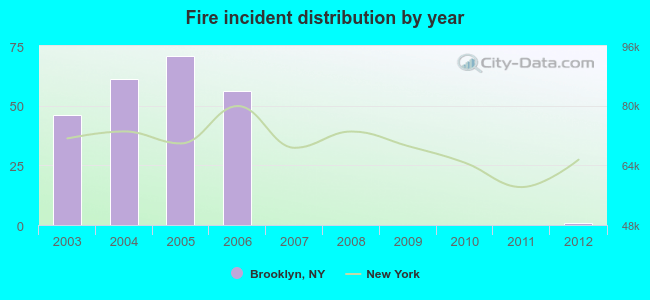 Based on the data from the years 2003 - 2012 the average number of fires per year is 24. The highest number of reported fires - 71 took place in 2005, and the least - 0 in 2007. The data has a dropping trend.
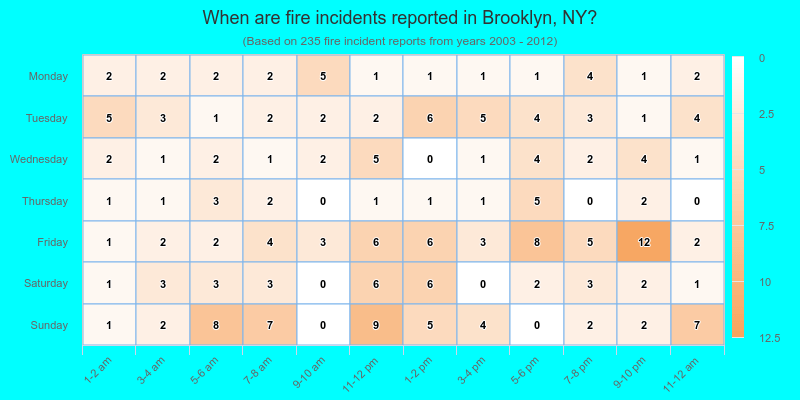
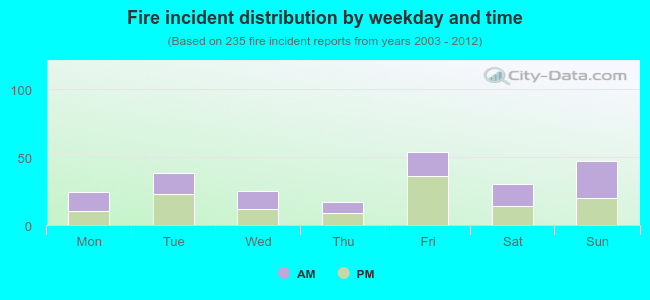 47.2% incidents where reported in the morning and 52.8% in the evening. The most fires (23.0%) took place on Friday, and the least (7.2%) on Thursday.
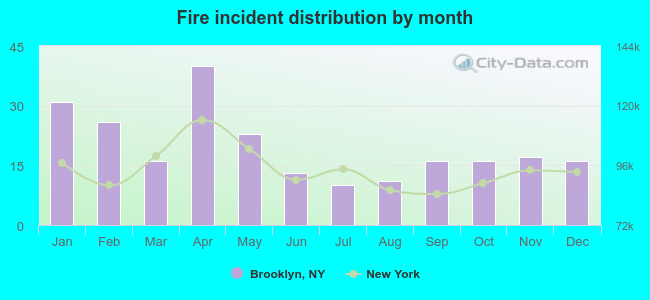 According to the 235 fire incidents from years 2003 - 2012 most fires (17.0%) took place during April, and the least (4.3%) in July.
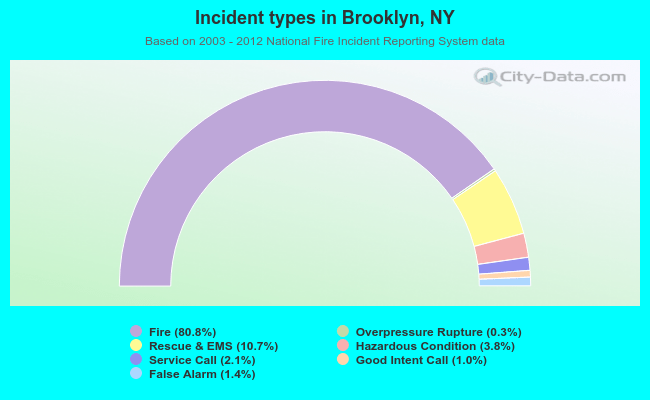 Out of all 291 cases reported during the years 2003 - 2012, the most belonged to the categories: Fire (80.8%), Rescue & EMS (10.7%), and Hazardous Condition (3.8%).
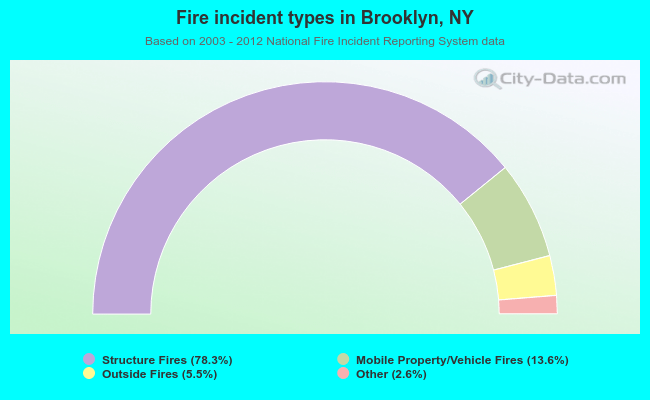 When looking into fire subcategories, the most reports belonged to: Structure Fires (78.3%), and Mobile Property/Vehicle Fires (13.6%).