| Fire incidents reported |
|---|
| Sreet name | Count |
|---|
| US HWY 50 HWY | 86 | | WALNUT ST | 38 | | COMMERCE | 34 | | MAIN ST | 32 | | STATE ROAD 135 | 32 | | COUNTY ROAD 200 N | 28 | | STATE ROAD 250 HWY | 28 | | COUNTY ROAD 150 N | 20 | | US HWY 50 | 20 | | BRIDGE ST | 18 | | COMMERCE ST | 18 | | CR 100 | 18 | | SPRING ST | 18 | | HIGH ST | 14 | | COUNTY ROAD 500 W | 12 | | CR 50 W | 12 | | EWING ST | 12 | | POPLAR ST | 12 | | STATE ROAD 135 HWY | 12 | | BLOOMINGTON RD | 10 | | COUNTY ROAD 150 E | 10 | | COUNTY ROAD 25 N RD | 10 | | COUNTY ROAD 425 N | 10 | | COUNTY ROAD 450 W | 10 | | COUNTY ROAD 460 W | 10 |
| | | Fire incidents reported |
|---|
| Sreet name | Count |
|---|
| COUNTY ROAD 650 W | 10 | | SUGAR ST | 10 | | BASE RD | 8 | | COUNTY ROAD 100 W | 8 | | COUNTY ROAD 225 W | 8 | | COUNTY ROAD 300 N | 8 | | COUNTY ROAD 400 E | 8 | | HILLVIEW TRAILER CT | 8 | | 200 | 6 | | BASE ROAD | 6 | | COUNTY ROAD 150 W | 6 | | COUNTY ROAD 25 EAST | 6 | | COUNTY ROAD 250 W | 6 | | COUNTY ROAD 275 W | 6 | | COUNTY ROAD 300 S | 6 | | COUNTY ROAD 350 W | 6 | | COUNTY ROAD 400 N | 6 | | COUNTY ROAD 50 S (OLD VAL | 6 | | CR 350 | 6 | | CROSS ST | 6 | | HILLVIEW TRAILER PARK | 6 | | STATE ROAD 39 | 6 | | VINE ST | 6 | | 4135 N CO. RD 650 W | 4 | | |
|
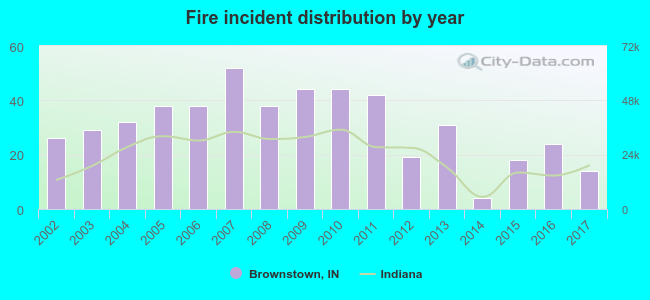 Based on the data from the years 2002 - 2017 the average number of fires per year is 31. The highest number of fire incidents - 52 took place in 2007, and the least - 4 in 2014. The data has a declining trend.
 26.3% incidents where reported in the morning and 73.7% in the evening. The most fires (20.6%) took place on Saturday, and the least (10.3%) on Thursday.
 Based on the 494 reports from years 2002 - 2017 most fires (14.0%) took place during March, and the least (5.7%) in May.
 Out of all 1,140 cases reported during the years 2002 - 2017, the most belonged to the categories: Fire (43.3%), Rescue & EMS (37.9%), and Hazardous Condition (10.6%).
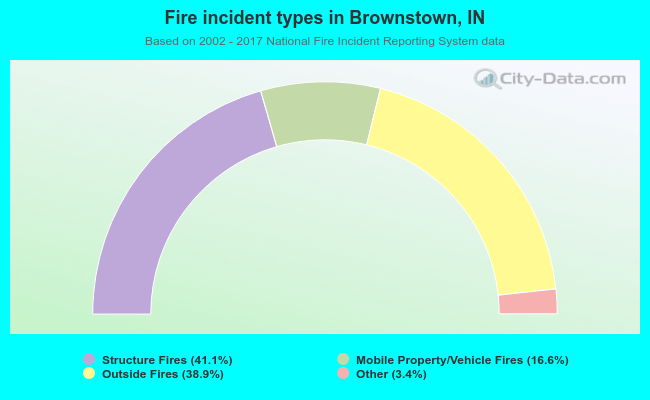 When looking into fire subcategories, the most reports belonged to: Structure Fires (41.1%), and Outside Fires (38.9%).