| Fire incidents reported |
|---|
| Sreet name | Count |
|---|
| HEBRON CHURCH ROAD | 10 | | OLD HWY 70 | 8 | | OLD HWY 70 BRUCETON RD | 8 | | HEBRON CHURCH RD | 6 | | OLD BRUCETON RD | 6 | | OLD BRUCETON ROAD | 6 | | ROUNDHOUSE ROAD | 6 | | 112 ALLEN ST | 4 | | 120 N. CARROLL | 4 | | 228 NORTH WYATT STREET | 4 | | BUTLER SCHOOL ROAD | 4 | | COTTON CREEK ROAD | 4 | | HIGHWAY 70 | 4 | | HWY 70 | 4 | | MAIN ST | 4 | | VALE MCKENZIE ROAD | 4 | | 1015 OLD BRUCETON RD | 2 | | 102 PRINCE ST | 2 | | 103 N CARROLL ST | 2 | | 105 ROWLAND AV | 2 | | 105 ROWLAND AV. | 2 | | 105 ROWLAND AVE | 2 | | 105 ROWLAND AVE. | 2 | | 107C BURTLER SPEEDWAY | 2 | | 109 N. CARROLL ST | 2 |
| | | Fire incidents reported |
|---|
| Sreet name | Count |
|---|
| 112 SOUTH CARROLL | 2 | | 112 WAYTT ST | 2 | | 115 MAPLE STREET | 2 | | 117 LEXINGTON ST | 2 | | 1170 ROWLAND MILL RD | 2 | | 1175 ROWLAND MILL RD | 2 | | 121 LEXINGTON ST | 2 | | 1295 BRUCETON VALE RD. | 2 | | 134 LEXINGTON ST | 2 | | 134 LEXINGTON STREET | 2 | | 138 GLENWOOD | 2 | | 147S.PINE | 2 | | 148 LEXINGTON ST | 2 | | 152 S PINE | 2 | | 152 S. SPRUCE ST. | 2 | | 1775 ROUNDHOUSE RD | 2 | | 1780 BUTLER SCHOOL ROAD | 2 | | 1795 ROWLAND MILL ROAD | 2 | | 1850 ROUND HOUSE RD | 2 | | 1920 COTTON CREEK RD | 2 | | 213 LANFORD LN | 2 | | 2210 ROWLAND MILL RD | 2 | | 228 CHEATHAM ST | 2 | | 228 WAYTT ST. | 2 | | 235 PARK CEMETERY LANE | 2 |
|
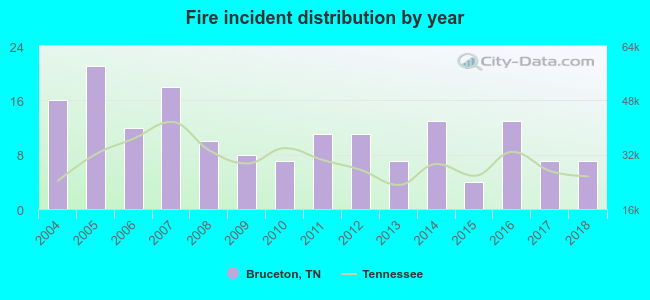 According to the data from the years 2004 - 2018 the average number of fire incidents per year is 11. The highest number of reported fires - 21 took place in 2005, and the least - 4 in 2015. The data has a declining trend.
 32.7% incidents where reported in the morning and 67.3% in the evening. The most fires (18.8%) took place on Wednesday, and the least (9.1%) on Tuesday.
 According to the 165 fire incident reports from years 2004 - 2018 most fires (13.3%) took place during July, and the least (2.4%) in August.
 Out of all 330 cases reported during the years 2004 - 2018, the most belonged to the categories: Fire (50.0%), Overpressure Rupture (27.6%), and Service Call (10.0%).
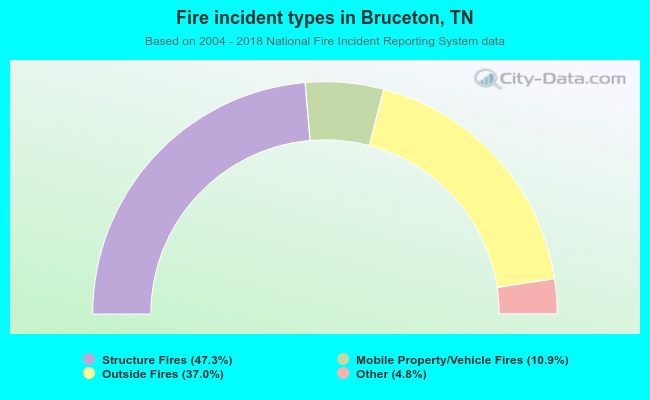 When looking into fire subcategories, the most reports belonged to: Structure Fires (47.3%), and Outside Fires (37.0%).