Brunswick: Fire Incidents, Maryland (MD)
Where are fire incidents reported in Brunswick, MD
Something went wrong! Please refresh the page.
|
| |||||||||||||||||||||||||||||||||||||||||||||||||||||||||||||||||||||||||||||||||||||||||||||||||||||||||||||
2003 - 2018 National Fire Incident Reporting System (NFIRS) incidents
- Incident types reported to NFIRS in Brunswick, MD
- 83230.3%Rescue & EMS
- 56120.4%Fire
- 54219.7%Good Intent Call
- 37213.5%Hazardous Condition
- 28110.2%Service Call
- 1375.0%False Alarm
- 200.7%Special Incident
- 30.1%Severe Weather
- Fire incident types reported to NFIRS in Brunswick, MD
- 34261.0%Structure Fires
- 10618.9%Other
- 9717.3%Outside Fires
- 162.9%Mobile Property/Vehicle Fires
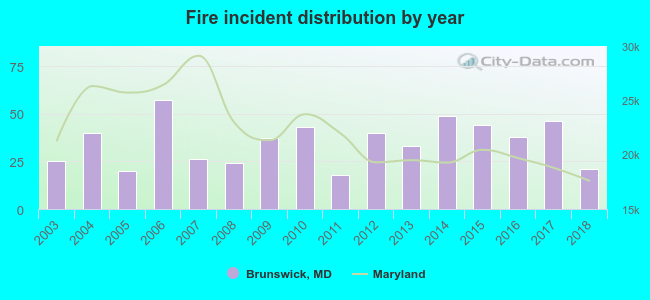 Based on the data from the years 2003 - 2018 the average number of fires per year is 35. The highest number of reported fires - 57 took place in 2006, and the least - 18 in 2011. The data has a declining trend.
The average number of yearly fire incidents per 10k residents in Brunswick, MD compared to nearest cities:
(Note: Based on data for the last 3 years, including only cities with population 5,000 and above)
| Brunswick: | 57.4 |
| Frederick: | 113.2 |
| Urbana: | 2.2 |
| Poolesville: | 20.7 |
| Walkersville: | 74.8 |
| Clarksburg: | 18.6 |
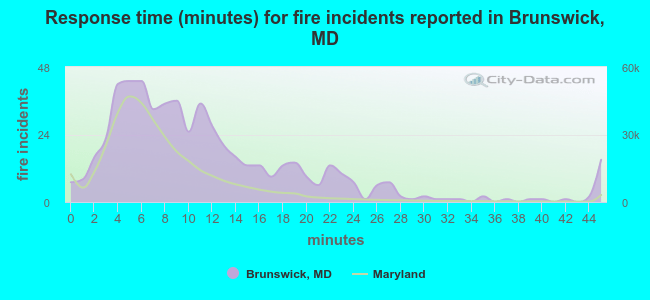 The median response time based on all reported fire incidents is 9 minutes. This is higher compared to the Maryland median value.
The median response time in Brunswick, MD compared to nearest cities:
(Note: Based on data for all years, including only cities with at least 500 fire incidents)
| Brunswick: | 9 minutes |
| Jefferson: | 9 minutes |
| Middletown: | 9 minutes |
| Sharpsburg: | 9 minutes |
| Frederick: | 7 minutes |
| Boonsboro: | 10 minutes |
| Myersville: | 10 minutes |
| Walkersville: | 8 minutes |
| Monrovia: | 8 minutes |
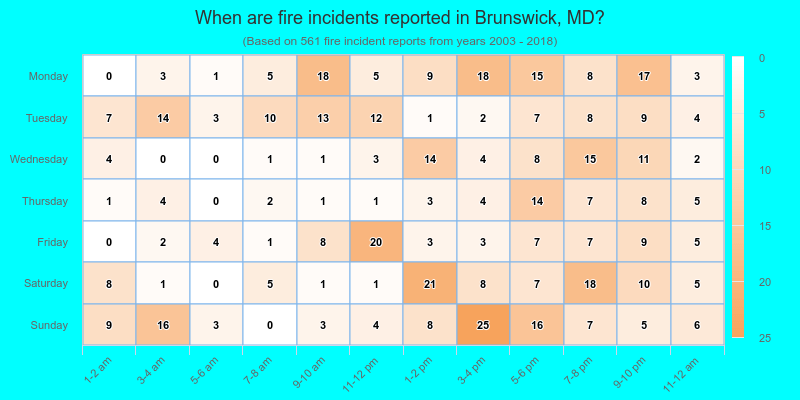
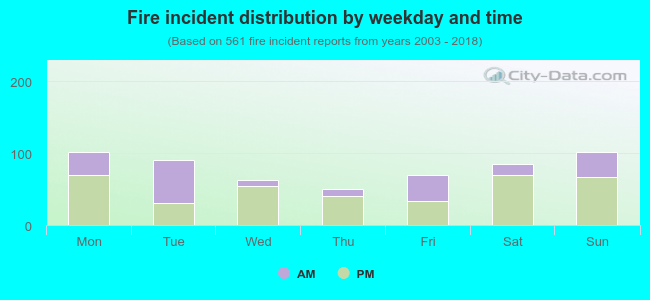 34.8% incidents where reported in the morning and 65.2% in the evening. The most fires (18.2%) took place on Monday, and the least (8.9%) on Thursday.
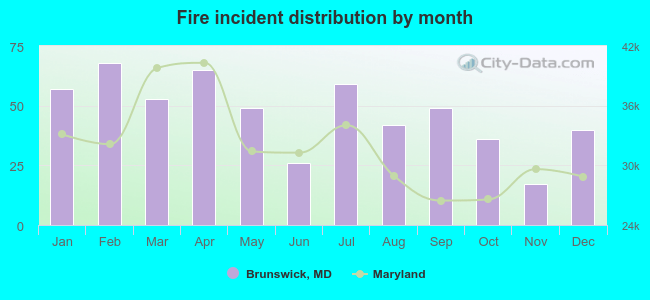 Based on the 561 reports from years 2003 - 2018 most fires (12.1%) took place during February, and the least (3.0%) in November.
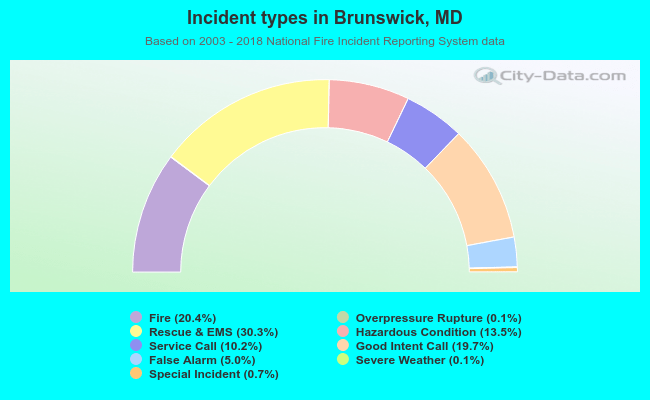 Out of all 2,750 cases reported during the years 2003 - 2018, the most belonged to the categories: Rescue & EMS (30.3%), Fire (20.4%), and Good Intent Call (19.7%).
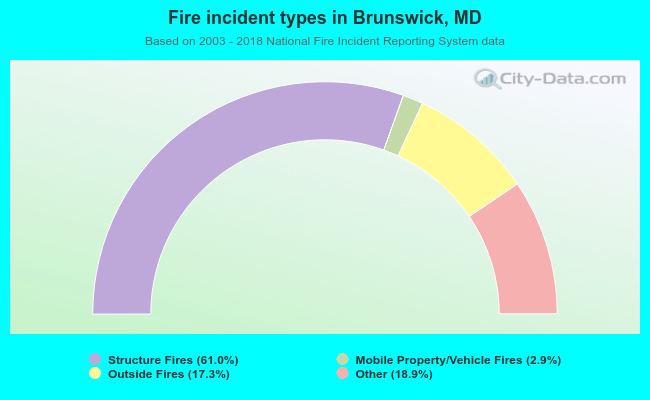 When looking into fire subcategories, the most incidents belonged to: Structure Fires (61.0%), and Other (18.9%).