| Fire incidents reported |
|---|
| Sreet name | Count |
|---|
| HIGHWAY 24 | 26 | | COUNTY ROAD 313 | 24 | | COUNTY ROAD 306 | 20 | | MAIN ST | 18 | | HWY 24 | 14 | | COLORADO AVE | 12 | | HIGHWAY 285 | 12 | | COUNTY ROAD 319 | 10 | | COUNTY ROAD 361 | 10 | | HIGHWAY 24285 | 10 | | COUNTY ROAD 300 | 8 | | COUNTY ROAD 321 | 8 | | COUNTY ROAD 383 | 8 | | GREGG DR | 8 | | LINDERMAN AVE | 8 | | ALSINA | 6 | | CEDAR ST | 6 | | COUNTY ROAD 339 | 6 | | COUNTY ROAD 340 | 6 | | COUNTY ROAD 358 | 6 | | COUNTY ROAD 384 | 6 | | HIGHWAY 24/285 | 6 | | PLEASANT AVE | 6 | | RAILROAD RD | 6 | | US HIGHWAY 24 NORTH | 6 |
| | | Fire incidents reported |
|---|
| Sreet name | Count |
|---|
| BASSAM DR | 4 | | BAYLOR | 4 | | CASTLE ROCK CIRCLE | 4 | | COUNTY ROAD 305 | 4 | | COUNTY ROAD 327 | 4 | | COUNTY ROAD 330 | 4 | | COUNTY ROAD 342 | 4 | | COUNTY ROAD 344 | 4 | | COUNTY ROAD 350 | 4 | | COUNTY ROAD 351 | 4 | | COUNTY ROAD 356 | 4 | | COUNTY ROAD 365 | 4 | | COUNTY ROAD 390 | 4 | | CROSSMAN | 4 | | CROSSMAN AVE | 4 | | HIGHWAY 50 | 4 | | HWY 24 N | 4 | | MEADOW LANE | 4 | | N COLORADO AVE | 4 | | PONDEROSA LN | 4 | | RAILROAD | 4 | | RAILROAD ST | 4 | | SAN JUAN | 4 | | SAN JUAN AVE | 4 | | |
|
 According to the data from the years 2002 - 2018 the average number of fires per year is 26. The highest number of fires - 44 took place in 2009, and the least - 6 in 2012. The data has a declining trend.
 31.9% incidents where reported in the morning and 68.1% in the evening. The most fires (16.5%) took place on Wednesday, and the least (11.2%) on Tuesday.
 According to the 448 fire incident reports from years 2002 - 2018 most fires (12.9%) took place during June, and the least (4.7%) in October.
 Out of all 2,441 cases reported during the years 2002 - 2018, the most belonged to the categories: Rescue & EMS (41.5%), Fire (18.4%), and Hazardous Condition (15.3%).
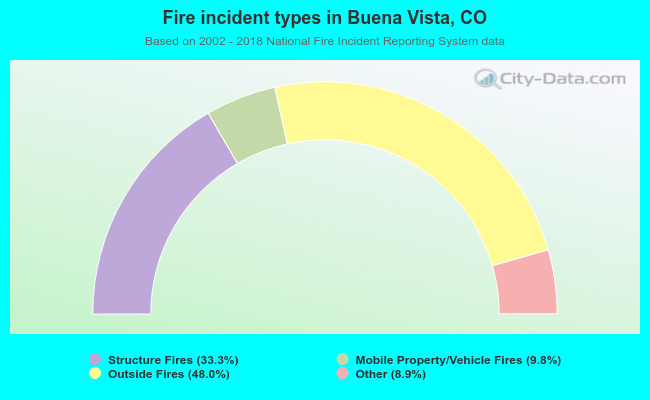 When looking into fire subcategories, the most reports belonged to: Outside Fires (48.0%), and Structure Fires (33.3%).