| Fire incidents reported |
|---|
| Sreet name | Count |
|---|
| FRONT ST | 44 | | 110TH AVE | 18 | | 401 E. FRONT ST. | 12 | | 95TH AVE | 12 | | CHESTNUT ST | 12 | | 130TH ST | 10 | | 4TH ST | 10 | | FRANKLIN ST | 10 | | 100TH AVE | 6 | | 109TH AVE | 6 | | 3RD ST | 6 | | SPRUCE ST | 6 | | 115TH AVE | 4 | | 115TH ST | 4 | | 140TH ST | 4 | | 145 ST | 4 | | 1638 W. FRONT ST. | 4 | | 301 E. FRONT ST. | 4 | | 6TH ST | 4 | | 701 E. FRONT ST. | 4 | | 707 HACKER ST. | 4 | | 708 FRONT ST. | 4 | | 81ST AVE | 4 | | 82ND AVE | 4 | | 96TH AVE | 4 |
| | | Fire incidents reported |
|---|
| Sreet name | Count |
|---|
| FRONT ST | 4 | | HWY22 HWY | 4 | | LAKE CANYADA | 4 | | OAKWOOD DR | 4 | | UTAH AVE | 4 | | #40 TIMBERLINE DR. | 2 | | #44 TIMBERLINE DR. | 2 | | 1002 HACKER ST. | 2 | | 100TH AVE. AT 128TH ST. | 2 | | 101ST AVE | 2 | | 102ND AVE | 2 | | 103 VALLEY HEIGHTS RD. | 2 | | 10373 118TH ST. | 2 | | 10502 118TH ST. | 2 | | 107 HACKER ST. | 2 | | 108 AVE | 2 | | 1100 BLK OF FRONT - E-Z W | 2 | | 1107 HACKER ST. | 2 | | 110TH AVE. & 130TH ST. | 2 | | 110TH AVE. @ LANDFILL ENTRANCE | 2 | | 11160 S. UTAH AVE. | 2 | | 1127 WALNUT ST. | 2 | | 1129 WALNUT ST. | 2 | | 11295 COON HUNTERS RD. | 2 | | |
|
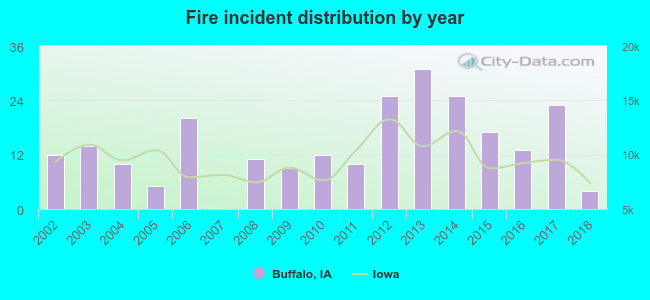 According to the data from the years 2002 - 2018 the average number of fire incidents per year is 14. The highest number of reported fire incidents - 31 took place in 2013, and the least - 0 in 2007. The data has a decreasing trend.
 33.2% incidents where reported in the morning and 66.8% in the evening. The most fires (16.6%) took place on Saturday, and the least (11.2%) on Monday.
 According to the 241 fires from years 2002 - 2018 most fires (19.1%) took place during April, and the least (5.4%) in January.
 Out of all 1,897 cases reported during the years 2002 - 2018, the most belonged to the categories: Rescue & EMS (73.1%), Fire (12.7%), and Hazardous Condition (5.7%).
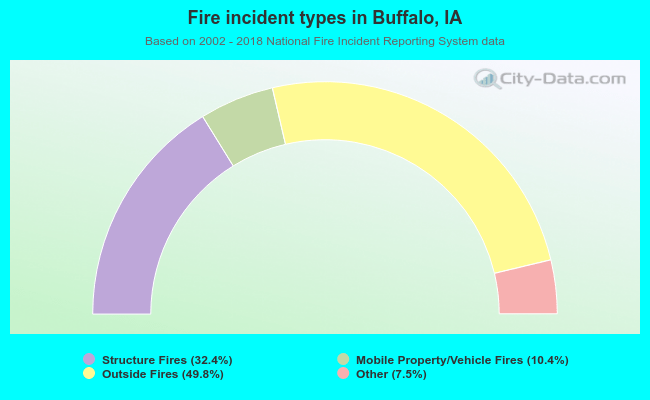 When looking into fire subcategories, the most reports belonged to: Outside Fires (49.8%), and Structure Fires (32.4%).