Buffalo: Fire Incidents, Kansas (KS)
Where are fire incidents reported in Buffalo, KS
Something went wrong! Please refresh the page.
|
| |||||||||||||||||||||||||||||||||||||||||||||||||||||||||||||||||||||||||||||||||||||||||||||||||||||||||||||
| Other | 9 | |||||||||||||||||||||||||||||||||||||||||||||||||||||||||||||||||||||||||||||||||||||||||||||||||||||||||||||
2005 - 2018 National Fire Incident Reporting System (NFIRS) incidents
- Incident types reported to NFIRS in Buffalo, KS
- 20983.3%Fire
- 197.6%Good Intent Call
- 145.6%Hazardous Condition
- 31.2%Rescue & EMS
- 31.2%Service Call
- 31.2%False Alarm
- Fire incident types reported to NFIRS in Buffalo, KS
- 14267.9%Outside Fires
- 3617.2%Structure Fires
- 2712.9%Mobile Property/Vehicle Fires
- 41.9%Other
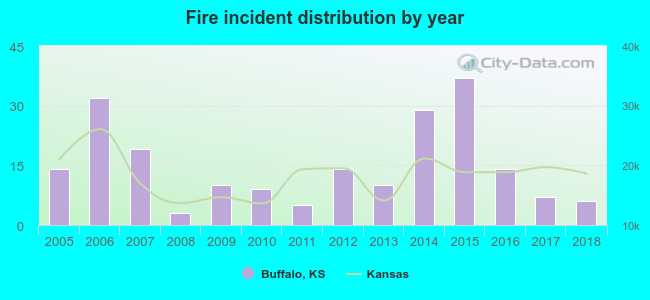 Based on the data from the years 2005 - 2018 the average number of fire incidents per year is 15. The highest number of fire incidents - 37 took place in 2015, and the least - 3 in 2008. The data has a declining trend.
 20.6% incidents where reported in the morning and 79.4% in the evening. The most fires (20.1%) took place on Sunday, and the least (10.0%) on Friday.
 Based on the 209 reports from years 2005 - 2018 most fires (24.4%) took place during March, and the least (1.0%) in May.
 Out of all 251 cases reported during the years 2005 - 2018, the most belonged to the categories: Fire (83.3%), Service Call (7.6%), and Rescue & EMS (5.6%).
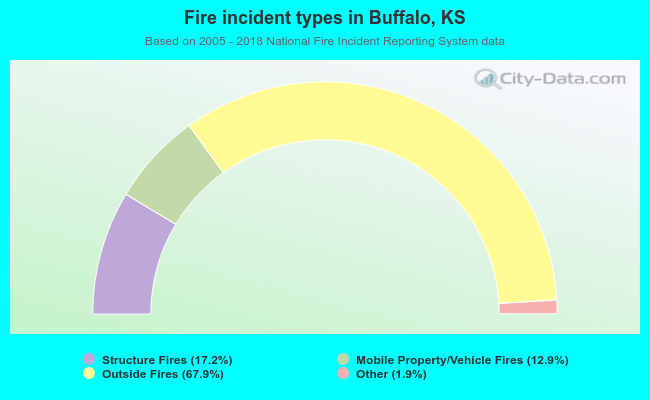 When looking into fire subcategories, the most reports belonged to: Outside Fires (67.9%), and Structure Fires (17.2%).