Buffalo: Fire Incidents, Missouri (MO)
Where are fire incidents reported in Buffalo, MO
Something went wrong! Please refresh the page.
|
| |||||||||||||||||||||||||||||||||||||||||||||||||||||||||||||||||||||||||||||||||||||||||||||||||||||||||||||
| Other | 79 | |||||||||||||||||||||||||||||||||||||||||||||||||||||||||||||||||||||||||||||||||||||||||||||||||||||||||||||
2002 - 2018 National Fire Incident Reporting System (NFIRS) incidents
- Incident types reported to NFIRS in Buffalo, MO
- 71039.4%Rescue & EMS
- 45725.4%Hazardous Condition
- 42723.7%Fire
- 1005.6%Good Intent Call
- 663.7%Service Call
- 221.2%False Alarm
- 110.6%Severe Weather
- 40.2%Special Incident
- 30.2%Overpressure Rupture
- Fire incident types reported to NFIRS in Buffalo, MO
- 17741.5%Structure Fires
- 17741.5%Outside Fires
- 5312.4%Mobile Property/Vehicle Fires
- 204.7%Other
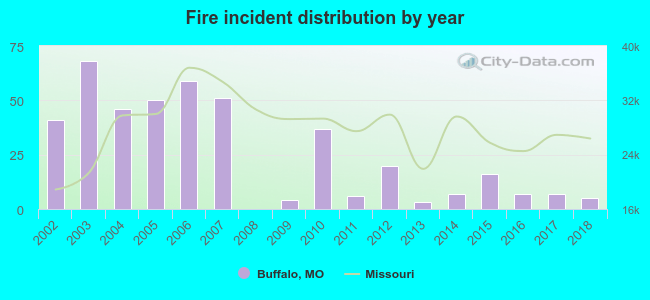 Based on the data from the years 2002 - 2018 the average number of fires per year is 25. The highest number of fires - 68 took place in 2003, and the least - 0 in 2008. The data has a declining trend.
 34.2% incidents where reported in the morning and 65.8% in the evening. The most fires (17.1%) took place on Sunday, and the least (11.2%) on Tuesday.
 According to the 427 fires from years 2002 - 2018 most fires (16.4%) took place during March, and the least (4.2%) in June.
 Out of all 1,800 cases reported during the years 2002 - 2018, the most belonged to the categories: Rescue & EMS (39.4%), Hazardous Condition (25.4%), and Fire (23.7%).
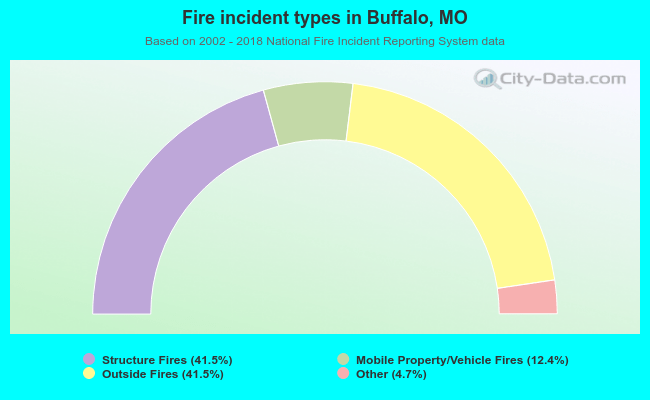 When looking into fire subcategories, the most reports belonged to: Structure Fires (41.5%), and Outside Fires (41.5%).