Bunn: Fire Incidents, North Carolina (NC)
Where are fire incidents reported in Bunn, NC
Something went wrong! Please refresh the page.
|
| |||||||||||||||||||||||||||||||||||||||||||||||||||||||||||||||||||||||||||||||||||||||||||||||||||||||||||||
2003 - 2018 National Fire Incident Reporting System (NFIRS) incidents
- Incident types reported to NFIRS in Bunn, NC
- 62445.1%Hazardous Condition
- 51937.5%Fire
- 1128.1%Good Intent Call
- 543.9%False Alarm
- 382.7%Rescue & EMS
- 342.5%Service Call
- 30.2%Special Incident
- Fire incident types reported to NFIRS in Bunn, NC
- 21641.6%Structure Fires
- 19136.8%Outside Fires
- 7013.5%Mobile Property/Vehicle Fires
- 428.1%Other
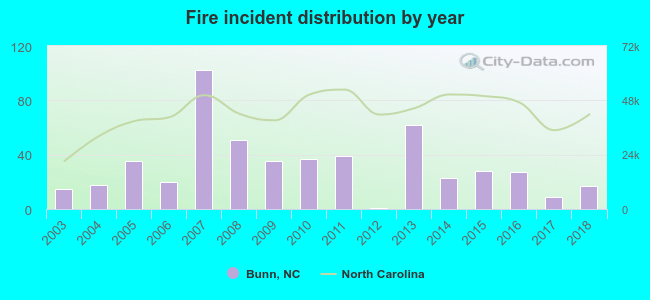 Based on the data from the years 2003 - 2018 the average number of fires per year is 32. The highest number of reported fires - 102 took place in 2007, and the least - 1 in 2012. The data has a growing trend.
 The median response time based on all reported fire incidents is 8 minutes. This is higher than the state median value.
The median response time in Bunn, NC compared to nearest cities:
(Note: Based on data for all years, including only cities with at least 500 fire incidents)
| Bunn: | 8 minutes |
| Spring Hope: | 11 minutes |
| Zebulon: | 6 minutes |
| Louisburg: | 7 minutes |
| Middlesex: | 9 minutes |
| Youngsville: | 9 minutes |
| Wendell: | 6 minutes |
| Bailey: | 10 minutes |
| Wake Forest: | 6 minutes |
 27.4% incidents where reported in the morning and 72.6% in the evening. The most fires (17.7%) took place on Saturday, and the least (10.0%) on Thursday.
 Based on the 519 fire incident reports from years 2003 - 2018 most fires (12.9%) took place during January, and the least (4.6%) in September.
 Out of all 1,385 cases reported during the years 2003 - 2018, the most belonged to the categories: Hazardous Condition (45.1%), Fire (37.5%), and Good Intent Call (8.1%).
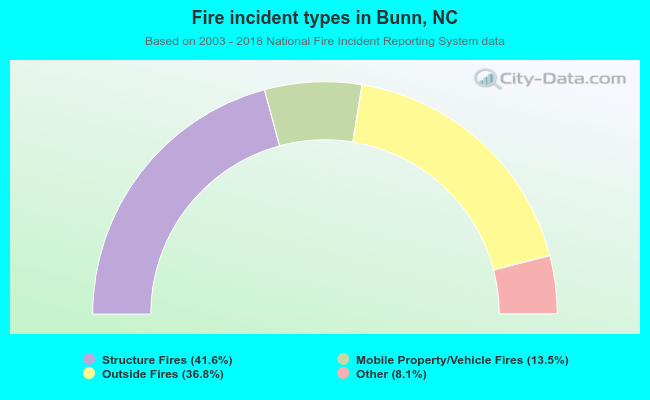 When looking into fire subcategories, the most incidents belonged to: Structure Fires (41.6%), and Outside Fires (36.8%).