| Fire incidents reported |
|---|
| Sreet name | Count |
|---|
| HIGHWAY 11 | 56 | | HWY 11 | 48 | | HIGHWAY 23 | 34 | | HWY 23 | 16 | | BURAS RIVER ROAD | 12 | | 11 HWY | 6 | | BOUZON LANE | 6 | | COLLINS LN | 6 | | DELTA AIRE DRIVE | 6 | | C L DILL LN | 4 | | DAYBROOK ROAD | 4 | | DOMINIC LN | 4 | | EAST COLLINS DRIVE | 4 | | GARTOUCIES LANE | 4 | | HERBERT HARVEY DRIVE | 4 | | KAREN LN | 4 | | MOUNT ZION LANE | 4 | | PP HWY 11 | 4 | | 37152 HWY PP11 | 2 | | 712 RIVER ROAD | 2 | | ANEMA TR PARK | 2 | | APP. BLOCK 3400 | 2 | | ARNOLD LANE | 2 | | BATTISTELLA ROAD | 2 | | BOUZON | 2 |
| | | Fire incidents reported |
|---|
| Sreet name | Count |
|---|
| BOUZON LN | 2 | | BROWN LANE | 2 | | BTWN HWYPP11&LA HWY 23 | 2 | | BURAS | 2 | | BURAS BOAT HARBOR | 2 | | BURAS BOAT HARBOR POMME D'OR RD | 2 | | BURAS HIGH SCHOOL | 2 | | CAZEZU DRIVE | 2 | | CIRCLE ST | 2 | | CITRUS CITY ACROSS HWY 11 & | 2 | | CL DILL LN | 2 | | CLARA LANE | 2 | | COMADELLE LN | 2 | | COMARDELLE LN | 2 | | DAIGLES LN | 2 | | EAST DAZET LN | 2 | | ELDORADO DR | 2 | | ELMER LN | 2 | | EYMARD LANE | 2 | | EYMARD LN | 2 | | FONTAIN LN | 2 | | FORT JACKSON MS RIVER BATURE | 2 | | FOSTER LANE | 2 | | FRIERSON | 2 | | |
|
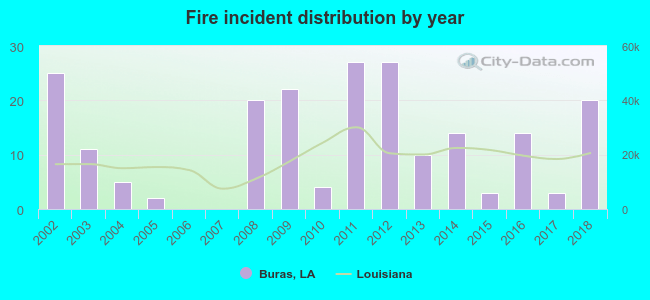 According to the data from the years 2002 - 2018 the average number of fire incidents per year is 12. The highest number of fire incidents - 27 took place in 2011, and the least - 0 in 2006. The data has a dropping trend.
 30.0% incidents where reported in the morning and 70.0% in the evening. The most fires (16.9%) took place on Thursday, and the least (12.1%) on Monday.
 Based on the 207 fire incidents from years 2002 - 2018 most fires (12.6%) took place during October, and the least (3.9%) in September.
 Out of all 630 cases reported during the years 2002 - 2018, the most belonged to the categories: Rescue & EMS (50.8%), Fire (32.9%), and Service Call (6.7%).
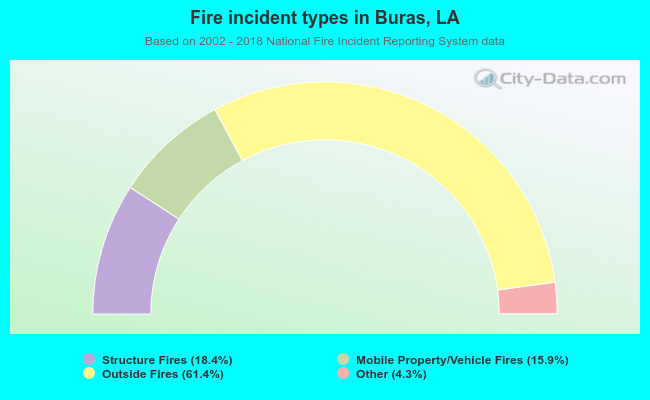 When looking into fire subcategories, the most reports belonged to: Outside Fires (61.4%), and Structure Fires (18.4%).