Burbank: Fire Incidents, Ohio (OH)
Where are fire incidents reported in Burbank, OH
Something went wrong! Please refresh the page.
|
| |||||||||||||||||||||||||||||||||||||||||||||||||||||||||||||||||||||||||||||||||||||||||||||||||||||||||
2002 - 2018 National Fire Incident Reporting System (NFIRS) incidents
- Incident types reported to NFIRS in Burbank, OH
- 18743.3%Rescue & EMS
- 12829.6%Fire
- 399.0%Hazardous Condition
- 358.1%Service Call
- 255.8%Good Intent Call
- 184.2%False Alarm
- Fire incident types reported to NFIRS in Burbank, OH
- 6853.1%Structure Fires
- 4333.6%Outside Fires
- 1511.7%Mobile Property/Vehicle Fires
- 21.6%Other
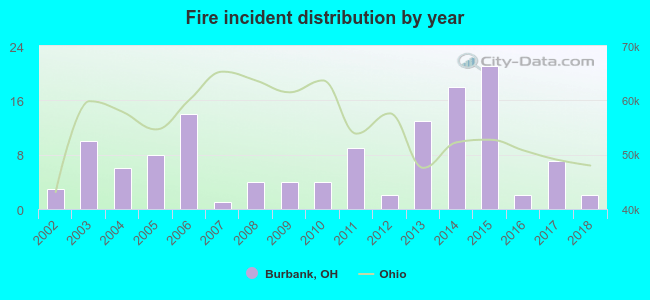 Based on the data from the years 2002 - 2018 the average number of fires per year is 8. The highest number of reported fires - 21 took place in 2015, and the least - 1 in 2007. The data has a dropping trend.
 33.6% incidents where reported in the morning and 66.4% in the evening. The most fires (19.5%) took place on Friday, and the least (11.7%) on Thursday.
 Based on the 128 incident reports from years 2002 - 2018 most fires (16.4%) took place during April, and the least (2.3%) in October.
 Out of all 432 cases reported during the years 2002 - 2018, the most belonged to the categories: Overpressure Rupture (43.3%), Fire (29.6%), and Rescue & EMS (9.0%).
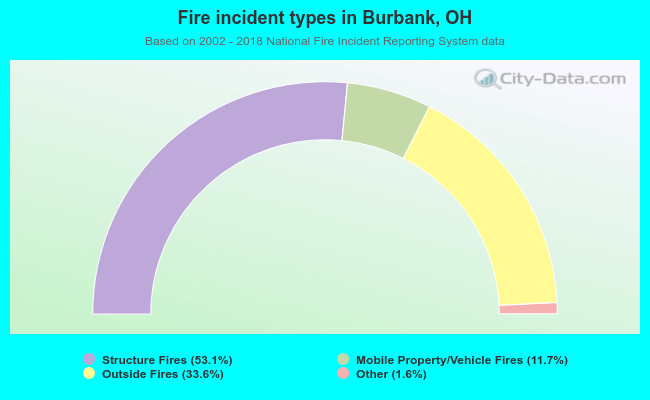 When looking into fire subcategories, the most incidents belonged to: Structure Fires (53.1%), and Outside Fires (33.6%).