| Fire incidents reported |
|---|
| Sreet name | Count |
|---|
| MUTUAL AID | 24 | | STEUBENVILLE PIKE | 18 | | BARTLEVILLE RD | 8 | | HANLIN STATION RD | 8 | | MEADOWCROFT RD | 8 | | CENTER AVE | 6 | | CROSS CREEK ROAD | 6 | | MAIN ST | 6 | | STEUBENVILLE PIKE | 6 | | CEDAR GROVE RD | 4 | | CENTER AVE BURGETTSTOWN | 4 | | CENTER AVE AVE | 4 | | CENTER AVE. BURGETTSTOWN | 4 | | CREEK LANE RD | 4 | | ELDERSVILLE RD | 4 | | FRANCIS MINE STATE ROAD | 4 | | MCCLURE RD | 4 | | MENEELY RD | 4 | | PITTSBURGH ST | 4 | | PLEASANT VALLEY RD | 4 | | RIDGE RD | 4 | | ROUTE 18 | 4 | | SCOTT HOLLOW RD | 4 | | STROPE RD | 4 | | T335 RD | 4 |
| | | Fire incidents reported |
|---|
| Sreet name | Count |
|---|
| US 22 HWY | 4 | | 20 HARRIS ST | 2 | | 98 VERLEST LN | 2 | | AIRPORT RD | 2 | | AMERICAN AVE | 2 | | AMERICAN AVE | 2 | | ARCHER LN | 2 | | ATLAS CHERRY VALLEY RD | 2 | | ATLAS CHERRY VALLEY RD | 2 | | BAVINGTON RD | 2 | | BEVERLY AVE | 2 | | BOWEN RD | 2 | | BUKEL RD | 2 | | BURGETTSTOWN PLAZA | 2 | | CAMPBELL DR | 2 | | CENTER AVE EXT | 2 | | CENTER AVENUE | 2 | | COLE SCHOOL RD | 2 | | CROSS OVER RD | 2 | | DINSMORE AVE | 2 | | ELDER STREET | 2 | | ELICH DR | 2 | | FAIRHILL STREET | 2 | | FIFTH ST | 2 | | FIRE RD | 2 |
|
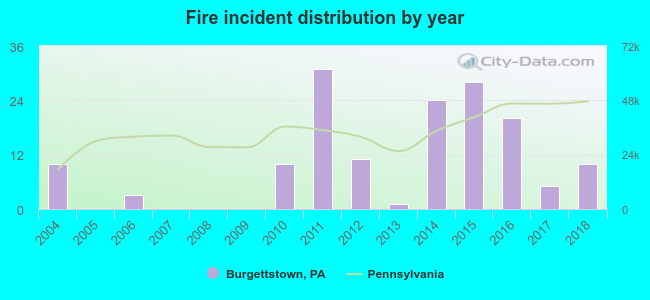 According to the data from the years 2004 - 2018 the average number of fire incidents per year is 10. The highest number of fires - 31 took place in 2011, and the least - 0 in 2005. The data has a constant trend.
 42.5% incidents where reported in the morning and 57.5% in the evening. The most fires (18.3%) took place on Sunday, and the least (11.1%) on Tuesday.
 Based on the 153 fires from years 2004 - 2018 most fires (14.4%) took place during March, and the least (3.3%) in July.
 Out of all 852 cases reported during the years 2004 - 2018, the most belonged to the categories: Overpressure Rupture (47.1%), Fire (18.0%), and Hazardous Condition (10.6%).
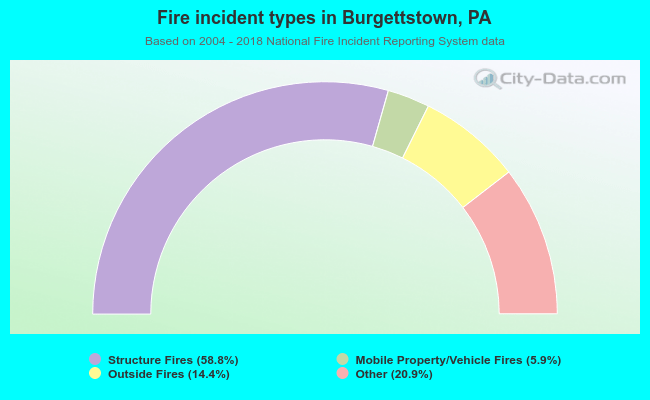 When looking into fire subcategories, the most incidents belonged to: Structure Fires (58.8%), and Other (20.9%).