Burlington: Fire Incidents, Indiana (IN)
Where are fire incidents reported in Burlington, IN
Something went wrong! Please refresh the page.
|
| |||||||||||||||||||||||||||||||||||||||||||||||||||||||||||||||||||||||||||||||||||||||||||||||||||||||||||||
2002 - 2017 National Fire Incident Reporting System (NFIRS) incidents
- Incident types reported to NFIRS in Burlington, IN
- 14538.0%Rescue & EMS
- 10226.7%Fire
- 4912.8%Hazardous Condition
- 4211.0%Service Call
- 287.3%Good Intent Call
- 102.6%Special Incident
- 51.3%False Alarm
- 10.3%Severe Weather
- Fire incident types reported to NFIRS in Burlington, IN
- 4140.2%Structure Fires
- 3736.3%Outside Fires
- 1312.7%Mobile Property/Vehicle Fires
- 1110.8%Other
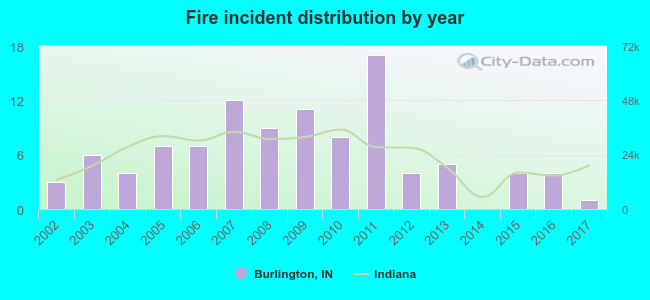 Based on the data from the years 2002 - 2017 the average number of fires per year is 6. The highest number of fire incidents - 17 took place in 2011, and the least - 0 in 2014. The data has a declining trend.
 29.4% incidents where reported in the morning and 70.6% in the evening. The most fires (18.6%) took place on Friday, and the least (10.8%) on Wednesday.
 Based on the 102 reports from years 2002 - 2017 most fires (13.7%) took place during April, and the least (4.9%) in May.
 Out of all 382 cases reported during the years 2002 - 2017, the most belonged to the categories: Overpressure Rupture (38.0%), Fire (26.7%), and Rescue & EMS (12.8%).
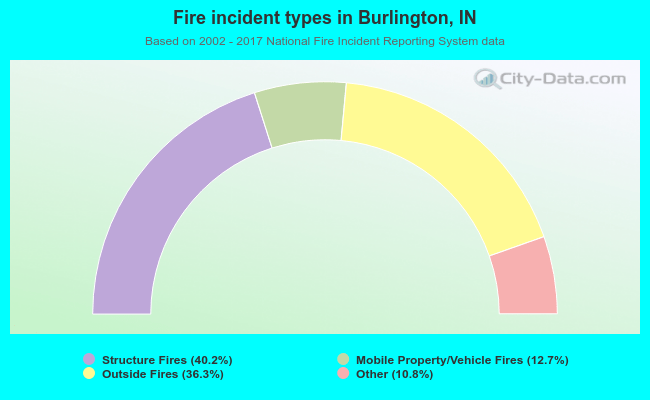 When looking into fire subcategories, the most reports belonged to: Structure Fires (40.2%), and Outside Fires (36.3%).