| Fire incidents reported |
|---|
| Sreet name | Count |
|---|
| 128 ST | 14 | | COUNTY ROAD 10 | 10 | | PARK RD | 8 | | 19TH AVE | 6 | | CNTY RD 15 RD | 6 | | 10900 19TH AVE NW | 4 | | 11101 COUNTY RD 15 W | 4 | | 12800 19TH AVE | 4 | | 12800 BLOCK 19 AVE | 4 | | 128TH ST NW | 4 | | 16300 46TH AVE NW | 4 | | 252 HWY | 4 | | 3RD AVE | 4 | | 46 AVE | 4 | | 7320 96TH ST NW | 4 | | 76TH ST NW | 4 | | 87 ST | 4 | | CNTY RD 15 LGTS | 4 | | COUNTY ROAD 15 | 4 | | COUNTY ROAD 15 W | 4 | | 100 ST | 2 | | 100TH ST | 2 | | 109 KITTLESON DR LGTS | 2 | | 11 AVE | 2 | | 1100 BLOCK 100ST NW | 2 |
| | | Fire incidents reported |
|---|
| Sreet name | Count |
|---|
| 114TH ST NW | 2 | | 12 AVE | 2 | | 12800 HWY 2&52 W | 2 | | 128TH AVE | 2 | | 12900 93RD AVE SW | 2 | | 13 AVE | 2 | | 13520 19 AVE NW | 2 | | 138 HWY 2 AND 52 W LGTS | 2 | | 13907 HWY 2 52 W LGTS | 2 | | 1415 5TH AVE SW | 2 | | 142 ST | 2 | | 142ND STREET ST | 2 | | 15 | 2 | | 16000 HWY 2 W | 2 | | 170TH AVE NW | 2 | | 170TH ST | 2 | | 18400 62ND AVE NW | 2 | | 19 COLTON AVE | 2 | | 19TH AVE NW | 2 | | 19TH AVE NW | 2 | | 2 & 52 WEST HWY | 2 | | 2&52 BYP | 2 | | 20TH AVE | 2 | | 21 KITTELSON DR | 2 | | |
|
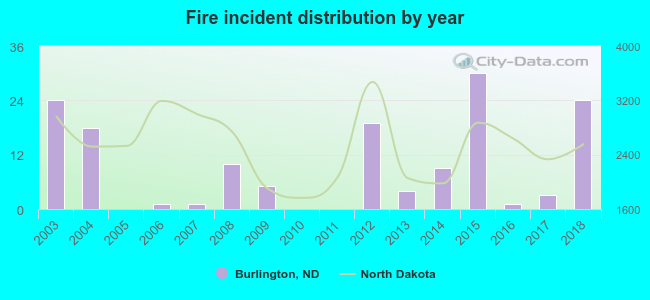 According to the data from the years 2003 - 2018 the average number of fires per year is 9. The highest number of fire incidents - 30 took place in 2015, and the least - 0 in 2005. The data has a constant trend.
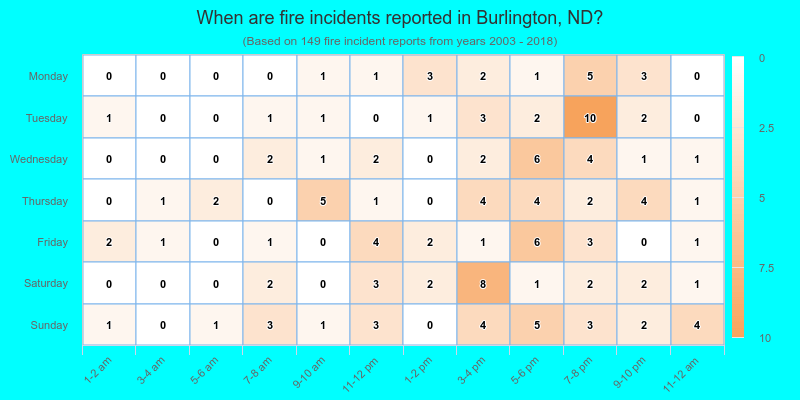
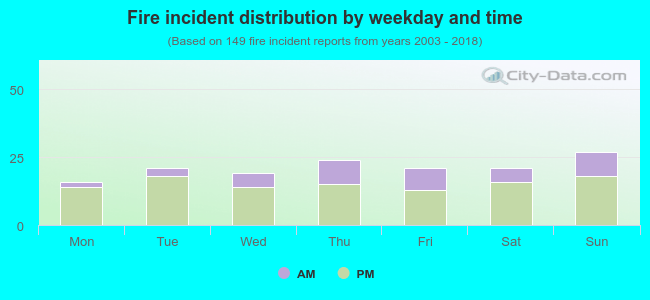 27.5% incidents where reported in the morning and 72.5% in the evening. The most fires (18.1%) took place on Sunday, and the least (10.7%) on Monday.
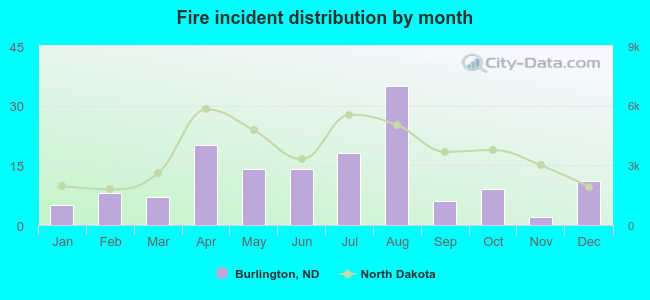 According to the 149 fires from years 2003 - 2018 most fires (23.5%) took place during August, and the least (1.3%) in November.
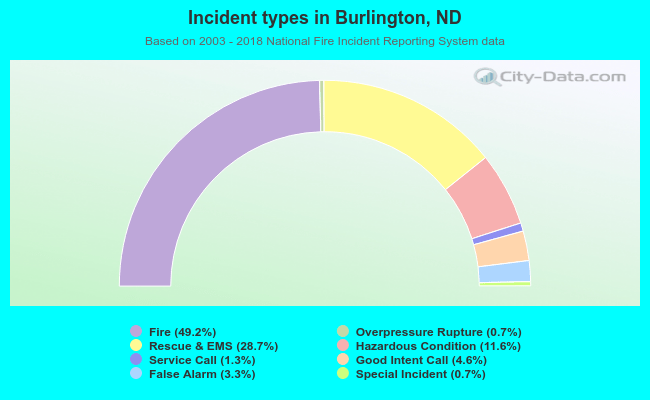 Out of all 303 cases reported during the years 2003 - 2018, the most belonged to the categories: Fire (49.2%), Rescue & EMS (28.7%), and Hazardous Condition (11.6%).
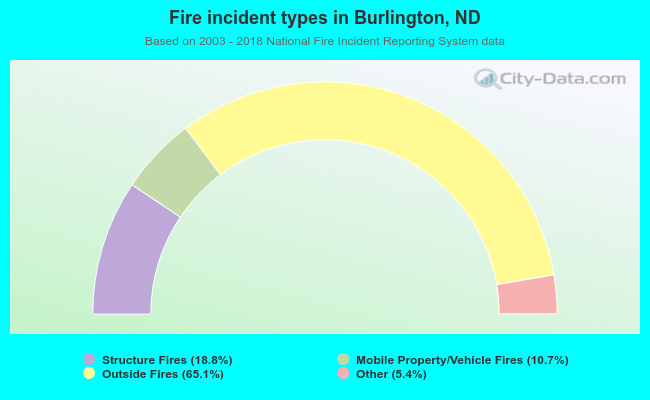 When looking into fire subcategories, the most reports belonged to: Outside Fires (65.1%), and Structure Fires (18.8%).