| Fire incidents reported |
|---|
| Sreet name | Count |
|---|
| HWY 77 | 14 | | 130TH ST | 6 | | 100TH | 4 | | 110TH | 4 | | 130TH | 4 | | 150TH ST | 4 | | 160TH ST | 4 | | 170TH | 4 | | 180TH ST | 4 | | 20TH | 4 | | 40TH RD | 4 | | 40TH YARROW | 4 | | BOYER | 4 | | DIAMOND | 4 | | HIGHWAY 77 HWY | 4 | | NW110THBOYER | 4 | | NW150THNW HOPKINS SWITCH | 4 | | PURITY SPRINGS | 4 | | VISTA | 4 | | WASHINGTON | 4 | | 110TH ST | 2 | | 110TH& BLUESTEM | 2 | | 12 WEST OF YARROW | 2 | | 120TH ST | 2 | | 1222 HWY 77 | 2 |
| | | Fire incidents reported |
|---|
| Sreet name | Count |
|---|
| 12486 NE BLUESTEM RD | 2 | | 12W OF YARROW ON 20TH | 2 | | 140 TH ST | 2 | | 150 NW BUTLER CO HWY 77 | 2 | | 150TH 77 HWY | 2 | | 1564NW 50TH HAVERHILL | 2 | | 160TH | 2 | | 170TH ST | 2 | | 20TH RD | 2 | | 20THVISTA | 2 | | 2139 20TH ST. | 2 | | 240 N 77 HWY | 2 | | 30 TH NIGHTHAWK | 2 | | 30TH | 2 | | 30TH VISTA | 2 | | 40 TH UPLAND | 2 | | 400 BLOCK MARION ST | 2 | | 40TH & HIGHWAY 77 | 2 | | 40TH & XAVIERE | 2 | | 40TH UPLAND | 2 | | 40THHWY77 | 2 | | 456 N HWY 77 | 2 | | 47TH | 2 | | 50TH&WAGONWHEEL | 2 | | |
|
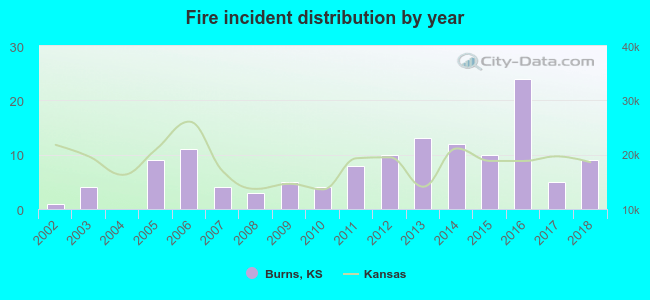 According to the data from the years 2002 - 2018 the average number of fire incidents per year is 8. The highest number of fires - 24 took place in 2016, and the least - 0 in 2004. The data has a growing trend.
 24.2% incidents where reported in the morning and 75.8% in the evening. The most fires (20.5%) took place on Wednesday, and the least (6.8%) on Sunday.
 According to the 132 fires from years 2002 - 2018 most fires (18.2%) took place during April, and the least (2.3%) in May.
 Out of all 206 cases reported during the years 2002 - 2018, the most belonged to the categories: Fire (64.1%), Overpressure Rupture (21.4%), and Hazardous Condition (8.3%).
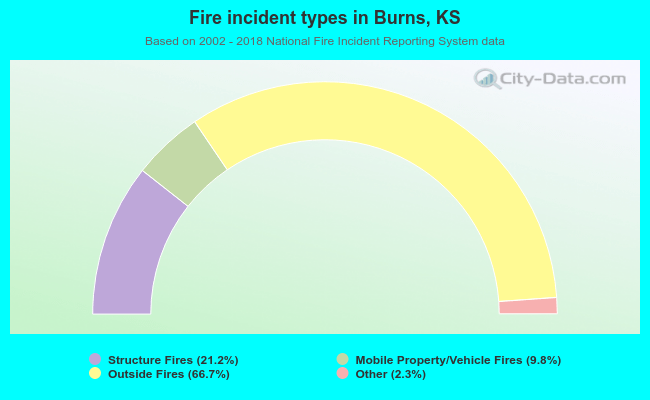 When looking into fire subcategories, the most reports belonged to: Outside Fires (66.7%), and Structure Fires (21.2%).