Burns: Fire Incidents, Oregon (OR)
Where are fire incidents reported in Burns, OR
Something went wrong! Please refresh the page.
|
| |||||||||||||||||||||||||||||||||||||||||||||||||||||||||||||||||||||||||||||||||||||||||||||||||||||||||||||
2002 - 2018 National Fire Incident Reporting System (NFIRS) incidents
- Incident types reported to NFIRS in Burns, OR
- 31461.1%Fire
- 6111.9%Service Call
- 5811.3%Hazardous Condition
- 265.1%False Alarm
- 244.7%Good Intent Call
- 234.5%Rescue & EMS
- 71.4%Special Incident
- 10.2%Overpressure Rupture
- Fire incident types reported to NFIRS in Burns, OR
- 15549.4%Structure Fires
- 10834.4%Outside Fires
- 4614.6%Mobile Property/Vehicle Fires
- 51.6%Other
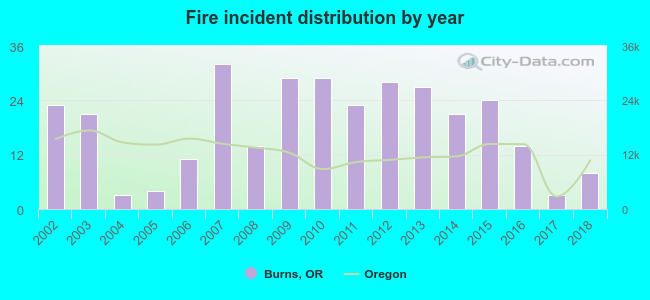 According to the data from the years 2002 - 2018 the average number of fire incidents per year is 18. The highest number of reported fires - 32 took place in 2007, and the least - 3 in 2004. The data has a decreasing trend.
 32.8% incidents where reported in the morning and 67.2% in the evening. The most fires (17.8%) took place on Friday, and the least (11.8%) on Saturday.
 Based on the 314 reports from years 2002 - 2018 most fires (11.8%) took place during January, and the least (4.8%) in February.
 Out of all 514 cases reported during the years 2002 - 2018, the most belonged to the categories: Fire (61.1%), Service Call (11.9%), and Hazardous Condition (11.3%).
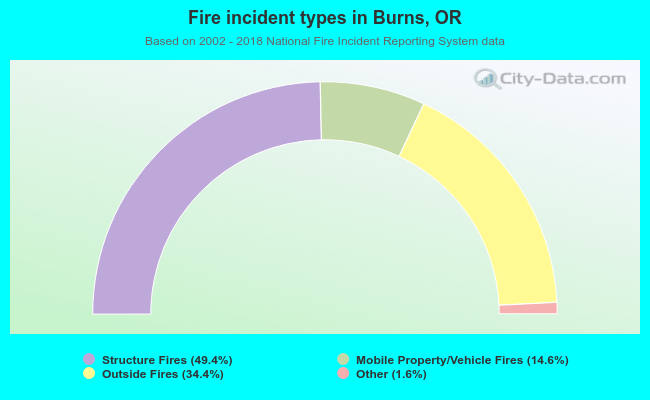 When looking into fire subcategories, the most incidents belonged to: Structure Fires (49.4%), and Outside Fires (34.4%).