Buxton: Fire Incidents, Maine (ME)
Where are fire incidents reported in Buxton, ME
Something went wrong! Please refresh the page.
|
| |||||||||||||||||||||||||||||||||||||||||||||||||||||||||||||||||||||||||||||||||||||||||||||||||||||||||||||
2003 - 2018 National Fire Incident Reporting System (NFIRS) incidents
- Incident types reported to NFIRS in Buxton, ME
- 2,54461.4%Rescue & EMS
- 55213.3%Hazardous Condition
- 3789.1%Service Call
- 3077.4%Fire
- 1884.5%Good Intent Call
- 1313.2%False Alarm
- 401.0%Severe Weather
- 50.1%Special Incident
- Fire incident types reported to NFIRS in Buxton, ME
- 13042.3%Structure Fires
- 11236.5%Outside Fires
- 3511.4%Mobile Property/Vehicle Fires
- 309.8%Other
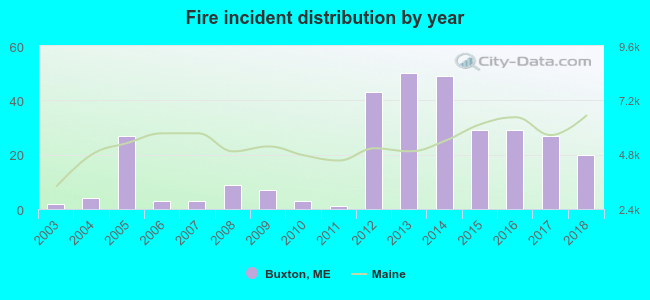 Based on the data from the years 2003 - 2018 the average number of fires per year is 19. The highest number of reported fire incidents - 50 took place in 2013, and the least - 1 in 2011. The data has an increasing trend.
The average number of yearly fire incidents per 10k residents in Buxton, ME compared to nearest cities:
(Note: Based on data for the last 3 years, including only cities with population 5,000 and above)
| Buxton: | 31.5 |
| Gorham: | 90.1 |
| Standish: | 22.3 |
| Waterboro: | 57.2 |
| Westbrook: | 33.0 |
| Saco: | 41.2 |
| Old Orchard Beach: | 26.7 |
| Biddeford: | 59.5 |
| South Portland: | 37.0 |
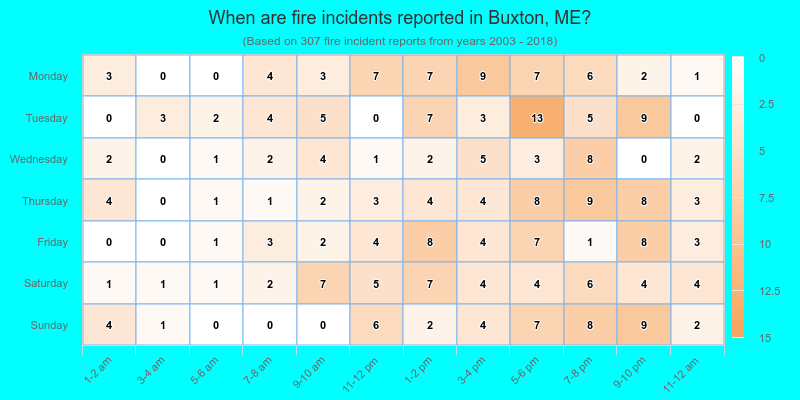
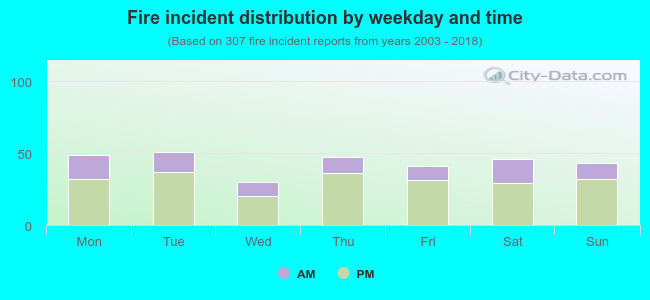 29.3% incidents where reported in the morning and 70.7% in the evening. The most fires (16.6%) took place on Tuesday, and the least (9.8%) on Wednesday.
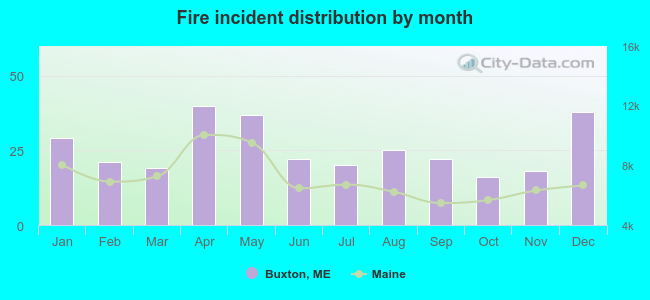 Based on the 307 reports from years 2003 - 2018 most fires (13.0%) took place during April, and the least (5.2%) in October.
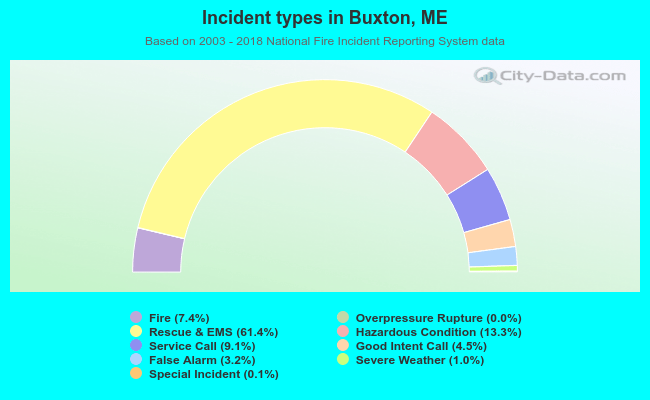 Out of all 4,146 cases reported during the years 2003 - 2018, the most belonged to the categories: Rescue & EMS (61.4%), Hazardous Condition (13.3%), and Service Call (9.1%).
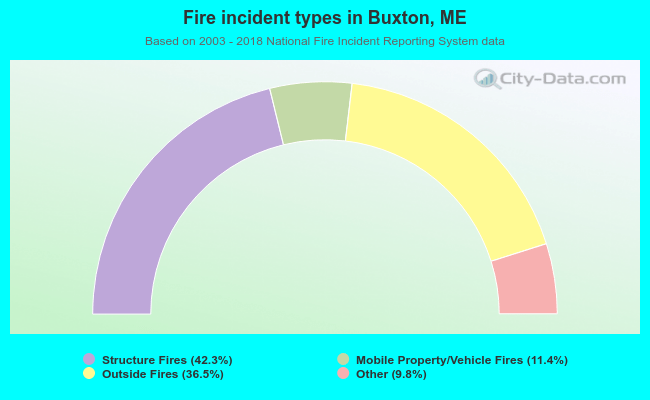 When looking into fire subcategories, the most reports belonged to: Structure Fires (42.3%), and Outside Fires (36.5%).