Byron: Fire Incidents, Minnesota (MN)
Where are fire incidents reported in Byron, MN
Something went wrong! Please refresh the page.
|
| |||||||||||||||||||||||||||||||||||||||||||||||||||||||||||||||||||||||||||||||||||||||||||||||||||||||||||||
2002 - 2018 National Fire Incident Reporting System (NFIRS) incidents
- Incident types reported to NFIRS in Byron, MN
- 28539.7%Fire
- 15421.4%Hazardous Condition
- 8411.7%Rescue & EMS
- 618.5%Good Intent Call
- 608.4%False Alarm
- 547.5%Service Call
- 172.4%Severe Weather
- 20.3%Special Incident
- 10.1%Overpressure Rupture
- Fire incident types reported to NFIRS in Byron, MN
- 10336.1%Outside Fires
- 8730.5%Structure Fires
- 6322.1%Mobile Property/Vehicle Fires
- 3211.2%Other
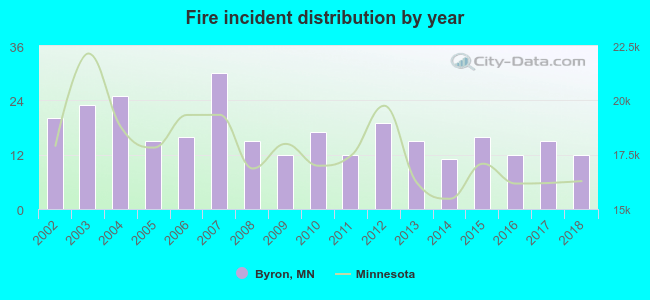 According to the data from the years 2002 - 2018 the average number of fire incidents per year is 17. The highest number of reported fires - 30 took place in 2007, and the least - 11 in 2014. The data has a decreasing trend.
The average number of yearly fire incidents per 10k residents in Byron, MN compared to nearest cities:
(Note: Based on data for the last 3 years, including only cities with population 5,000 and above)
| Byron: | 25.0 |
| Kasson: | 22.0 |
| Rochester: | 15.9 |
| Stewartville: | 14.9 |
| Owatonna: | 24.8 |
| Austin: | 22.3 |
| Faribault: | 43.5 |
| Red Wing: | 14.4 |
| Northfield: | 30.0 |

 28.4% incidents where reported in the morning and 71.6% in the evening. The most fires (17.2%) took place on Wednesday, and the least (11.2%) on Monday.
 According to the 285 reports from years 2002 - 2018 most fires (15.4%) took place during April, and the least (4.2%) in January.
 Out of all 718 cases reported during the years 2002 - 2018, the most belonged to the categories: Fire (39.7%), Hazardous Condition (21.4%), and Rescue & EMS (11.7%).
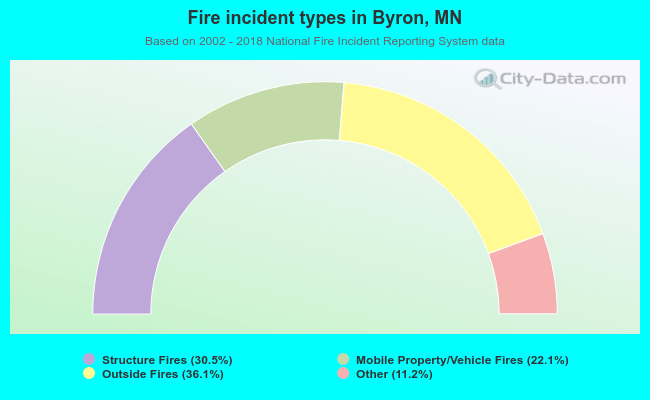 When looking into fire subcategories, the most incidents belonged to: Outside Fires (36.1%), and Structure Fires (30.5%).