| Fire incidents reported |
|---|
| Sreet name | Count |
|---|
| COITS POND RD | 10 | | MAIN ST | 8 | | RT 215 | 8 | | WHITTIER HILL RD | 8 | | BRICKETTS CROSSING | 6 | | DANVILLE HILL RD | 6 | | MAIN ST ST | 6 | | RTE 215 | 6 | | SOUTH WALDEN RD | 6 | | WEST HILL POND RD | 6 | | 4014 CABOT RD | 4 | | CABOT | 4 | | CABOT PLAINS RD | 4 | | COITS POUND RD | 4 | | HOUSTON HILL RD | 4 | | LAST RD | 4 | | LOVELY RD | 4 | | LOVELY RD RD | 4 | | ROUTE 2 | 4 | | ROUTE 215 | 4 | | SOUTH WALDEN RD | 4 | | URBAN RD | 4 | | US RT 2 | 4 | | WEST HILL POND RD | 4 | | 1086 THISTLE HILL ROAD | 2 |
| | | Fire incidents reported |
|---|
| Sreet name | Count |
|---|
| 1407 WHITTER HILL ROAD | 2 | | 1455 COITS POND ROAD | 2 | | 1636 ROUTE 232 | 2 | | 1758 ROUTE 215 | 2 | | 1758 RT 215 S | 2 | | 1785 COITS POND RD | 2 | | 1854 DUCHARME ROAD | 2 | | 186 ELM ST | 2 | | 186 ELM STREET | 2 | | 2 RT | 2 | | 2032 RT 215 S | 2 | | 215 RD | 2 | | 215 RT | 2 | | 2296 SOUTH WALDEN ROAD | 2 | | 2405 SOUTH WALDEN ROAD | 2 | | 2595 WALDEN RD | 2 | | 2936 MAIN STREET | 2 | | 2964 MAIN ST | 2 | | 304 SANDY BEACH | 2 | | 3046 S. WALDEN ROAD | 2 | | 3046 WALDEN RD | 2 | | 377 SAWMILL RD | 2 | | 421 DANVILLE HILL ROAD | 2 | | 433 WEST HILL POND ROAD | 2 | | 506 THISTLE HILL RD | 2 |
|
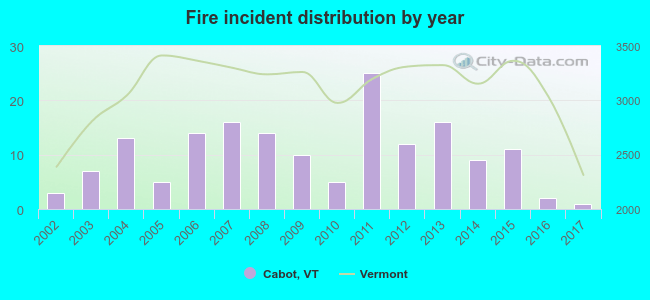 According to the data from the years 2002 - 2017 the average number of fires per year is 10. The highest number of fire incidents - 25 took place in 2011, and the least - 1 in 2017. The data has a decreasing trend.
 38.7% incidents where reported in the morning and 61.3% in the evening. The most fires (24.5%) took place on Saturday, and the least (7.4%) on Monday.
 Based on the 163 reports from years 2002 - 2017 most fires (17.2%) took place during January, and the least (2.5%) in June.
 Out of all 264 cases reported during the years 2002 - 2017, the most belonged to the categories: Fire (61.7%), Rescue & EMS (20.1%), and Overpressure Rupture (9.8%).
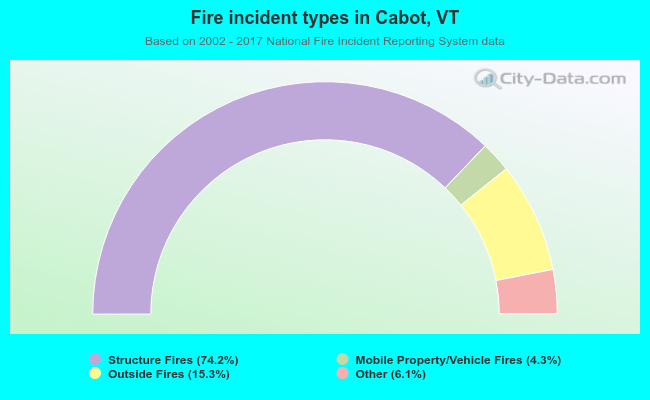 When looking into fire subcategories, the most incidents belonged to: Structure Fires (74.2%), and Outside Fires (15.3%).