Calhoun: Fire Incidents, Tennessee (TN)
Where are fire incidents reported in Calhoun, TN
Something went wrong! Please refresh the page.
|
| |||||||||||||||||||||||||||||||||||||||||||||||||||||||||||||||||||||||||||||||||||||||||||||||||||||||||||||
| Other | 126 | |||||||||||||||||||||||||||||||||||||||||||||||||||||||||||||||||||||||||||||||||||||||||||||||||||||||||||||
2003 - 2018 National Fire Incident Reporting System (NFIRS) incidents
- Incident types reported to NFIRS in Calhoun, TN
- 67654.4%Fire
- 29523.8%Rescue & EMS
- 1209.7%Good Intent Call
- 947.6%Hazardous Condition
- 302.4%Service Call
- 221.8%False Alarm
- 40.3%Special Incident
- Fire incident types reported to NFIRS in Calhoun, TN
- 32948.7%Outside Fires
- 21131.2%Structure Fires
- 9313.8%Mobile Property/Vehicle Fires
- 436.4%Other
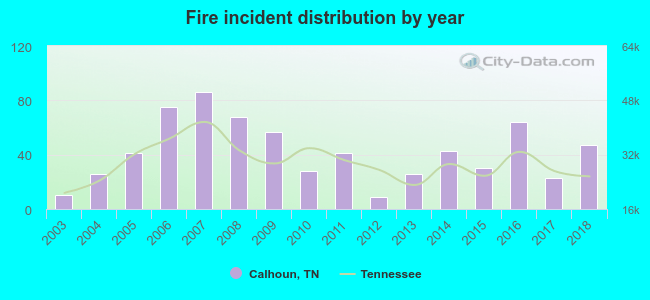 According to the data from the years 2003 - 2018 the average number of fires per year is 42. The highest number of reported fires - 86 took place in 2007, and the least - 9 in 2012. The data has a growing trend.
 The median response time based on all reported fire incidents is 5 minutes. This is lower compared to the state median value.
The median response time in Calhoun, TN compared to nearest cities:
(Note: Based on data for all years, including only cities with at least 500 fire incidents)
| Calhoun: | 5 minutes |
| Riceville: | 11 minutes |
| Cleveland: | 6 minutes |
| Etowah: | 8 minutes |
| Athens: | 6 minutes |
| Decatur: | 10 minutes |
| Englewood: | 8 minutes |
| Niota: | 10 minutes |
| Dayton: | 4 minutes |
 36.2% incidents where reported in the morning and 63.8% in the evening. The most fires (15.4%) took place on Friday, and the least (13.0%) on Monday.
 According to the 676 reports from years 2003 - 2018 most fires (11.8%) took place during February, and the least (5.0%) in July.
 Out of all 1,242 cases reported during the years 2003 - 2018, the most belonged to the categories: Fire (54.4%), Rescue & EMS (23.8%), and Good Intent Call (9.7%).
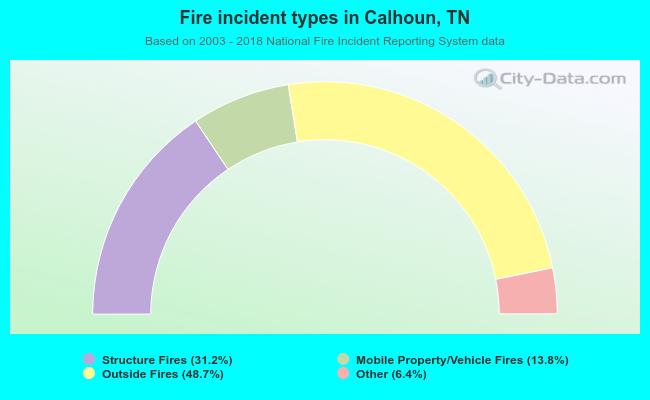 When looking into fire subcategories, the most incidents belonged to: Outside Fires (48.7%), and Structure Fires (31.2%).