Cambridge: Fire Incidents, New York (NY)
Where are fire incidents reported in Cambridge, NY
Something went wrong! Please refresh the page.
|
| |||||||||||||||||||||||||||||||||||||||||||||||||||||||||||||||||||||||||||||||||||||||||||||||||||||||||||||
2005 - 2018 National Fire Incident Reporting System (NFIRS) incidents
- Incident types reported to NFIRS in Cambridge, NY
- 49842.5%Hazardous Condition
- 33628.7%Fire
- 12810.9%Rescue & EMS
- 937.9%False Alarm
- 736.2%Good Intent Call
- 423.6%Service Call
- Fire incident types reported to NFIRS in Cambridge, NY
- 20962.2%Structure Fires
- 9428.0%Outside Fires
- 267.7%Mobile Property/Vehicle Fires
- 72.1%Other
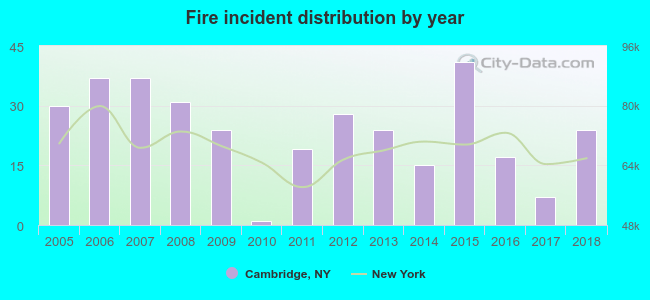 Based on the data from the years 2005 - 2018 the average number of fires per year is 24. The highest number of fire incidents - 41 took place in 2015, and the least - 1 in 2010. The data has a decreasing trend.
 Based on the reports from the years 2005 - 2018 the average number of fire-related casualties per year is 0. The highest number of casualties - 2 took place in 2006, and the lowest - 0 in 2005. The data has an increasing trend.
 30.7% incidents where reported in the morning and 69.3% in the evening. The most fires (18.2%) took place on Sunday, and the least (10.4%) on Thursday.
 Based on the 336 reports from years 2005 - 2018 most fires (19.0%) took place during April, and the least (3.0%) in July.
 Out of all 1,171 cases reported during the years 2005 - 2018, the most belonged to the categories: Rescue & EMS (42.5%), Fire (28.7%), and Overpressure Rupture (10.9%).
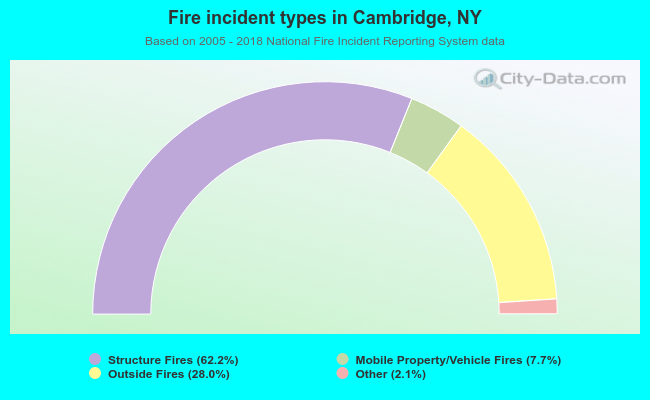 When looking into fire subcategories, the most reports belonged to: Structure Fires (62.2%), and Outside Fires (28.0%).