| Fire incidents reported |
|---|
| Sreet name | Count |
|---|
| DUPONT HWY | 42 | | WILLOW GROVE RD | 20 | | OLD NORTH RD | 14 | | BANNING RD | 8 | | WESTVILLE RD | 8 | | ALMSHOUSE RD | 6 | | GREEN ACRES DR | 6 | | MAIN ST | 6 | | MOOSE LODGE RD | 6 | | MUD MILL RD | 6 | | PEACH ST | 6 | | SPOONBILL CIR | 6 | | STATE ST | 6 | | VINING RUN | 6 | | BERRYTOWN RD | 4 | | CAMDEN-WYOMING AVE | 4 | | CENTER ST | 4 | | EAST ST | 4 | | LAMBERT DR | 4 | | RISING SUN RD | 4 | | S. DUPONT HIGHWAY | 4 | | SORGHUM MILL RD | 4 | | TOBACCO RD | 4 | | UPPER KING RD | 4 | | VOSHELLS MILL RD | 4 |
| | | Fire incidents reported |
|---|
| Sreet name | Count |
|---|
| WAL-MART DR | 4 | | WALMART DR | 4 | | WESTVILLE RD | 4 | | WILLIAMS ST | 4 | | WILLOW AVE | 4 | | WILLOWGROVE RD | 4 | | 105 WESLEY ST ST | 2 | | 3487 MUDMILLO RD | 2 | | 3581 WALNUT SHADE RD | 2 | | 365 PONY TRACK ROAD | 2 | | 381 ALMSHOUSE RAOD | 2 | | 6150 WILLOW GROVE RD | 2 | | 6150 WILLOW GROVE RD. | 2 | | 6207 MUD MILL RD | 2 | | 907 COW MARSH CREEK RD | 2 | | 925 HAZELVILLE RD. | 2 | | ASBURY AVE | 2 | | BANNING | 2 | | BARNEY JENKINS RD | 2 | | BIG DITCH RD | 2 | | BIG DITCH ROAD | 2 | | BIRDY LN | 2 | | BIRKDALE LANE | 2 | | BISON RD | 2 | | |
|
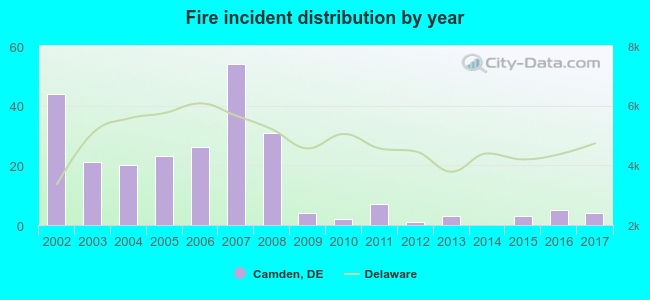 According to the data from the years 2002 - 2017 the average number of fires per year is 16. The highest number of reported fire incidents - 54 took place in 2007, and the least - 0 in 2014. The data has a decreasing trend.
 33.9% incidents where reported in the morning and 66.1% in the evening. The most fires (19.0%) took place on Friday, and the least (11.3%) on Sunday.
 Based on the 248 fire incidents from years 2002 - 2017 most fires (12.5%) took place during February, and the least (4.8%) in November.
 Out of all 801 cases reported during the years 2002 - 2017, the most belonged to the categories: Fire (31.0%), Rescue & EMS (28.1%), and Overpressure Rupture (14.7%).
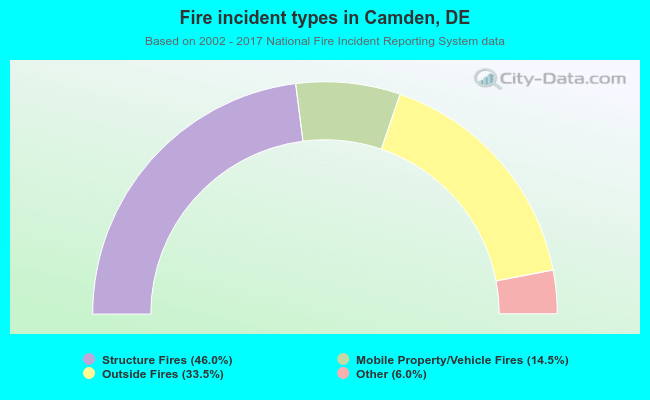 When looking into fire subcategories, the most incidents belonged to: Structure Fires (46.0%), and Outside Fires (33.5%).