Camden: Fire Incidents, New York (NY)
Where are fire incidents reported in Camden, NY
Something went wrong! Please refresh the page.
|
| |||||||||||||||||||||||||||||||||||||||||||||||||||||||||||||||||||||||||||||||||||||||||||||||||||||||||||||
2003 - 2018 National Fire Incident Reporting System (NFIRS) incidents
- Incident types reported to NFIRS in Camden, NY
- 77737.5%Rescue & EMS
- 54226.1%Good Intent Call
- 35517.1%Hazardous Condition
- 1637.9%Fire
- 1075.2%Service Call
- 663.2%Severe Weather
- 602.9%False Alarm
- Fire incident types reported to NFIRS in Camden, NY
- 6741.1%Other
- 5634.4%Structure Fires
- 3420.9%Outside Fires
- 63.7%Mobile Property/Vehicle Fires
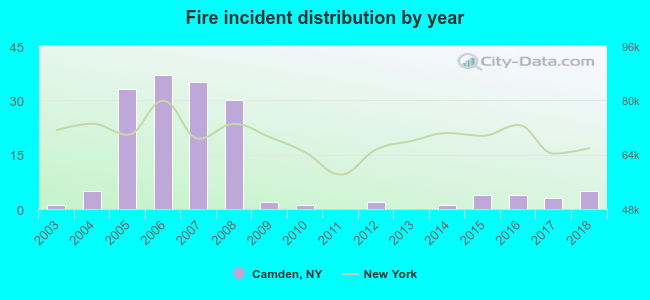 Based on the data from the years 2003 - 2018 the average number of fires per year is 10. The highest number of fire incidents - 37 took place in 2006, and the least - 0 in 2011. The data has an increasing trend.
 27.6% incidents where reported in the morning and 72.4% in the evening. The most fires (20.2%) took place on Saturday, and the least (11.0%) on Tuesday.
 Based on the 163 reports from years 2003 - 2018 most fires (20.9%) took place during April, and the least (3.7%) in August.
 Out of all 2,074 cases reported during the years 2003 - 2018, the most belonged to the categories: Rescue & EMS (37.5%), Good Intent Call (26.1%), and Hazardous Condition (17.1%).
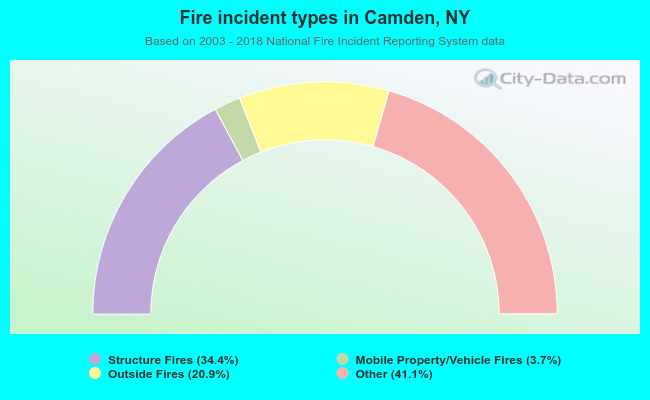 When looking into fire subcategories, the most incidents belonged to: Other (41.1%), and Structure Fires (34.4%).