| Fire incidents reported |
|---|
| Sreet name | Count |
|---|
| INTERSTATE 86 RD | 20 | | STATE ROUTE 415 RD | 10 | | COUNTY ROUTE 333 RD | 8 | | COUNTY ROUTE 17 RD | 6 | | CURTIS COOPERS RD RD | 6 | | MEADS CREEK RD | 6 | | COUNTY ROUTE 1 RD | 4 | | COUNTY ROUTE 125 | 4 | | COUNTY ROUTE 125 RD | 4 | | ECKLES RD RD | 4 | | GREEN MEADOW ACRES | 4 | | GREEN MEADOW ACRES RD | 4 | | INTERSTATE 86 | 4 | | INTERSTATE 86 REST AREA RD | 4 | | MAIN ST | 4 | | STONY RIDGE RD RD | 4 | | WOLF RUN RD | 4 | | WOLF RUN RD | 4 | | WOLF RUN RD RD | 4 | | 4946 CTY RTE 17 | 2 | | 7003 CNTY. RTE 333 | 2 | | BEEMAN HOLLOW RD | 2 | | CARRIAGE DR RD | 2 | | CENTER ST RD | 2 | | CLARK RD. | 2 |
| | | Fire incidents reported |
|---|
| Sreet name | Count |
|---|
| CLINTON ST | 2 | | COUNTY ROUTE #1 | 2 | | COUNTY ROUTE 17 | 2 | | COUNTY ROUTE 333 | 2 | | COUNTY RT. 125 | 2 | | COUNTY RTE 333 | 2 | | CR 125 | 2 | | CROSS ST | 2 | | CRYSTAL LANE | 2 | | CT RT 17 | 2 | | CT RT 4 CURTIS RD | 2 | | CTY RT 17 | 2 | | CURTIS COOPER RD RD | 2 | | CURTIS COOPERS RD | 2 | | CURTIS ROOPER RD | 2 | | DRY RUN ROAD | 2 | | FROG HOLLOW | 2 | | FROGHOLLOW RD. | 2 | | GULF RD | 2 | | HANRAHAN RD | 2 | | HANRAHAN ROAD | 2 | | I-86 EAST BOUND | 2 | | I-86 WEST | 2 | | I86 | 2 | | I86 EAST | 2 |
|
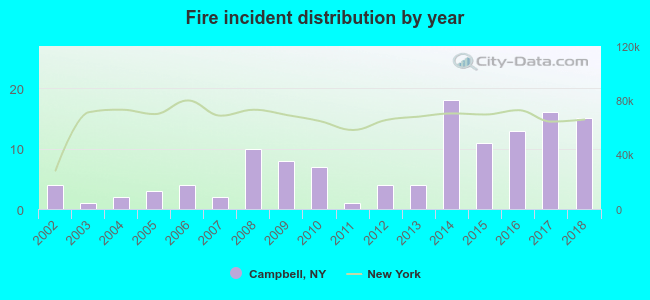 Based on the data from the years 2002 - 2018 the average number of fires per year is 7. The highest number of fire incidents - 18 took place in 2014, and the least - 1 in 2003. The data has an increasing trend.
 25.2% incidents where reported in the morning and 74.8% in the evening. The most fires (23.6%) took place on Wednesday, and the least (8.1%) on Friday.
 Based on the 123 reports from years 2002 - 2018 most fires (17.9%) took place during May, and the least (3.3%) in June.
 Out of all 1,528 cases reported during the years 2002 - 2018, the most belonged to the categories: Rescue & EMS (59.3%), Hazardous Condition (12.6%), and Good Intent Call (9.9%).
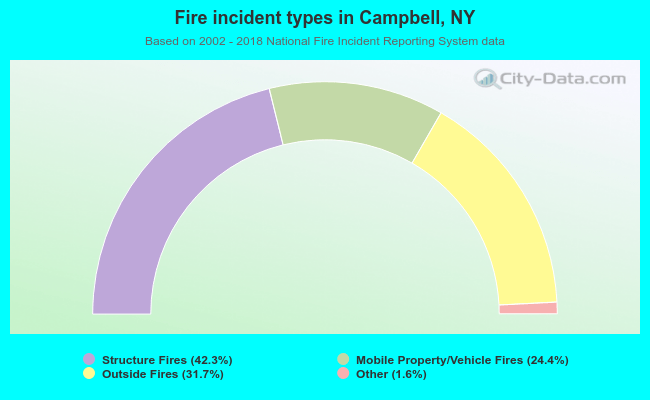 When looking into fire subcategories, the most incidents belonged to: Structure Fires (42.3%), and Outside Fires (31.7%).