| Fire incidents reported |
|---|
| Sreet name | Count |
|---|
| BEAVER DAM RD | 16 | | RABBIT FLAT RD | 16 | | WATERSHED RD | 16 | | CANEY CREEK RD | 10 | | MORGANTOWN RD | 10 | | WINDY RIDGE RD | 10 | | FALLS OF ROUGH RD | 8 | | MAPLE ST | 8 | | MORGANTOWN ST | 8 | | NEAFUS RD | 8 | | WESTERN KY PKY | 8 | | CANEYVILLE RD | 6 | | DOG CREEK RD | 6 | | HUDSON RD | 6 | | MAIN ST | 6 | | WALNUT GROVE RD | 6 | | WILSON CHURCH RD | 6 | | YEAMAN RD | 6 | | 62 HWY | 4 | | BLUE CREEK RD. | 4 | | BOWLING GREEN RD | 4 | | BOWLING GREEN ROAD | 4 | | BROOKS RD | 4 | | CENTER ST | 4 | | DAY RD | 4 |
| | | Fire incidents reported |
|---|
| Sreet name | Count |
|---|
| HAYES CEMETARY RD | 4 | | J D HUDSON RD | 4 | | LAWERANCE HAYES RD | 4 | | LAYMAN RD | 4 | | MAHURIN CEMETARY RD | 4 | | MILL ST | 4 | | MORGANTOWN ROAD | 4 | | PINE KNOB RD | 4 | | PINE KNOB ROAD | 4 | | TOUSEY RD | 4 | | WESTERN KENTUCKY PKY | 4 | | 14420 CANEYVILLE RD | 2 | | 2616 RABBIT FLAT RD | 2 | | 3333 CANEY CREEK RD | 2 | | 5100 CANEY CREEK RD | 2 | | 518 BROOKS RD | 2 | | 6445 LOVE-LEE RD | 2 | | 707 PHARIS LANE | 2 | | BEECH GROVE RD | 2 | | BID REEDY RD | 2 | | BLOCK DUFF RD | 2 | | BOWLING GREEN RD | 2 | | BUCK CREEK ROAD | 2 | | CANE FORD RD | 2 | | |
|
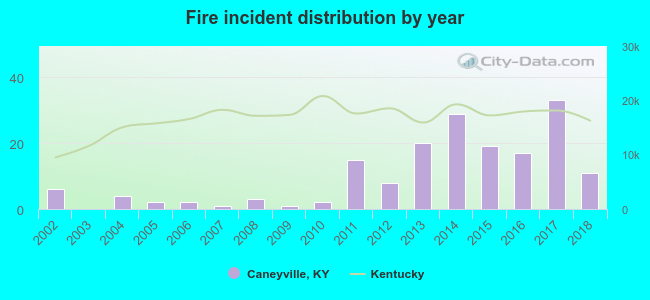 Based on the data from the years 2002 - 2018 the average number of fires per year is 10. The highest number of reported fire incidents - 33 took place in 2017, and the least - 0 in 2003. The data has a growing trend.
 33.5% incidents where reported in the morning and 66.5% in the evening. The most fires (17.9%) took place on Saturday, and the least (9.2%) on Monday.
 According to the 173 reports from years 2002 - 2018 most fires (16.2%) took place during February, and the least (4.0%) in August.
 Out of all 1,094 cases reported during the years 2002 - 2018, the most belonged to the categories: Overpressure Rupture (64.0%), Fire (15.8%), and Service Call (8.8%).
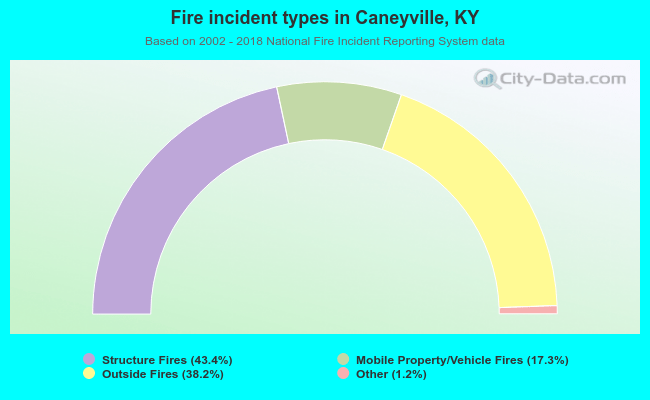 When looking into fire subcategories, the most incidents belonged to: Structure Fires (43.4%), and Outside Fires (38.2%).