Canonsburg: Fire Incidents, Pennsylvania (PA)
Where are fire incidents reported in Canonsburg, PA
Something went wrong! Please refresh the page.
|
| |||||||||||||||||||||||||||||||||||||||||||||||||||||||||||||||||||||||||||||||||||||||||||||||||||||||||||||
| Other | 29 | |||||||||||||||||||||||||||||||||||||||||||||||||||||||||||||||||||||||||||||||||||||||||||||||||||||||||||||
2010 - 2018 National Fire Incident Reporting System (NFIRS) incidents
- Incident types reported to NFIRS in Canonsburg, PA
- 39125.1%Fire
- 38424.7%Hazardous Condition
- 26617.1%Good Intent Call
- 19912.8%False Alarm
- 1489.5%Rescue & EMS
- 1398.9%Service Call
- 110.7%Severe Weather
- 100.6%Overpressure Rupture
- 80.5%Special Incident
- Fire incident types reported to NFIRS in Canonsburg, PA
- 22958.6%Structure Fires
- 8521.7%Outside Fires
- 4712.0%Mobile Property/Vehicle Fires
- 307.7%Other
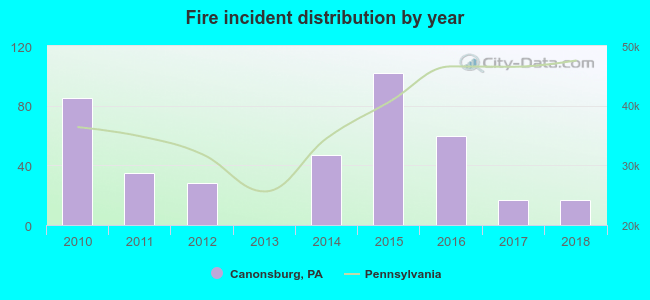 Based on the data from the years 2010 - 2018 the average number of fire incidents per year is 43. The highest number of reported fire incidents - 102 took place in 2015, and the least - 0 in 2013. The data has a decreasing trend.
The average number of yearly fire incidents per 10k residents in Canonsburg, PA compared to nearest cities:
(Note: Based on data for the last 3 years, including only cities with population 5,000 and above)
| Canonsburg: | 35.1 |
| Washington: | 72.6 |
| Bridgeville: | 110.1 |
| Bethel Park: | 12.3 |
| Scott Township: | 10.7 |
| Castle Shannon: | 2.8 |
| Carnegie: | 28.2 |
| Dormont: | 26.6 |
| Whitehall: | 1.8 |
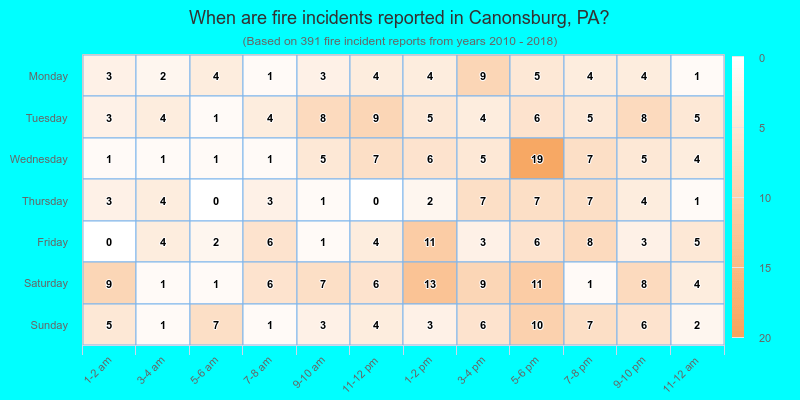
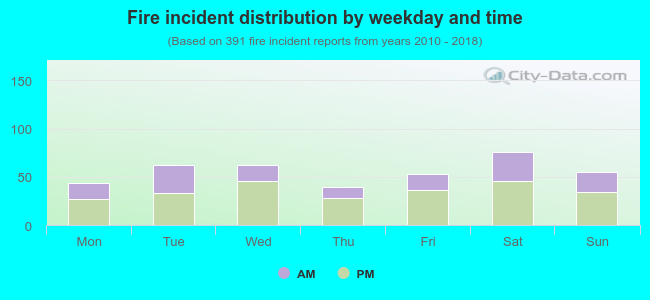 36.1% incidents where reported in the morning and 63.9% in the evening. The most fires (19.4%) took place on Saturday, and the least (10.0%) on Thursday.
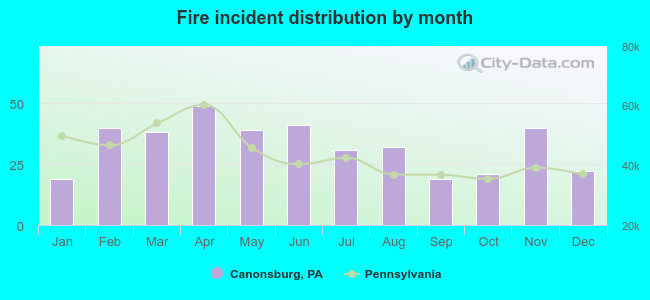 According to the 391 reports from years 2010 - 2018 most fires (12.5%) took place during April, and the least (4.9%) in January.
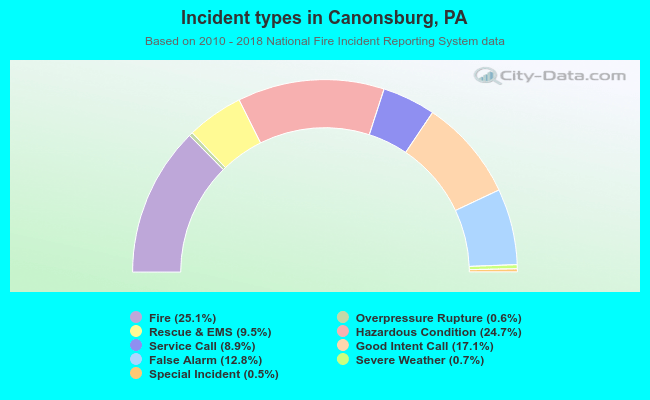 Out of all 1,556 cases reported during the years 2010 - 2018, the most belonged to the categories: Fire (25.1%), Hazardous Condition (24.7%), and Good Intent Call (17.1%).
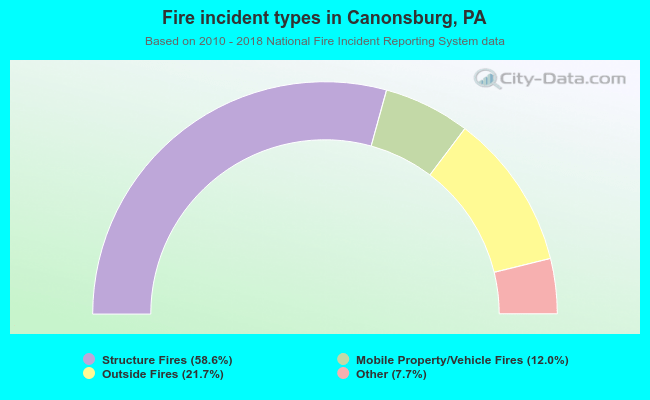 When looking into fire subcategories, the most incidents belonged to: Structure Fires (58.6%), and Outside Fires (21.7%).