| Fire incidents reported |
|---|
| Sreet name | Count |
|---|
| HWY 380 | 18 | | HWY 380 & SANDIA | 10 | | PINE LODGE RD | 8 | | HWY 48 | 6 | | 186 E GRANDVIEW | 4 | | BOGLE RD | 4 | | BOGLE ROAD | 4 | | HIGHWAY 246 | 4 | | MM 88 HWY 380 | 4 | | 104 ASPEN SPACE 7 | 2 | | 106 LARGO | 2 | | 107 EAST CREEK RD | 2 | | 107 WANDA | 2 | | 110 WEST CEDAR | 2 | | 111 TINA | 2 | | 116 EAST SMOKEY BEAR BLVD | 2 | | 116 LAVANDE | 2 | | 117 WEST LAST | 2 | | 120 BONITA | 2 | | 124 VALLEY VIEW | 2 | | 125 PINE LODGE ROAD | 2 | | 133 ROCK ROAD | 2 | | 1350 JACK'S PEAK LOOP | 2 | | 140 LAVANO | 2 | | 1400 STATE HIGHWAY 48 | 2 |
| | | Fire incidents reported |
|---|
| Sreet name | Count |
|---|
| 143 CONNOR CORT | 2 | | 143 CONNOR CT | 2 | | 157 MAIN RD | 2 | | 157 WEST GRANDVIEW | 2 | | 201 LONG ROAD | 2 | | 202 LOND ROAD | 2 | | 205 CONNER COUT | 2 | | 217 5TH STREET | 2 | | 243 BANKCROFT | 2 | | 25 MILES NORTH OF CAPITAN | 2 | | 380 HWY | 2 | | 3RD ST | 2 | | 412 FOURTH STREET | 2 | | 433 SMOKEY BEAR BLVD | 2 | | 435 SMOKEY BEAR BLVD. | 2 | | 440 WEST 4TH ST | 2 | | 442 2ND ST | 2 | | 46 MILE NE OF CAPITAN | 2 | | 4TH ST | 2 | | 694 MT CAPITAN | 2 | | 8452 HWY 380 | 2 | | BACA CAMP GROUND | 2 | | BANCROFT | 2 | | BOGLE PATOS ROADS | 2 | | |
|
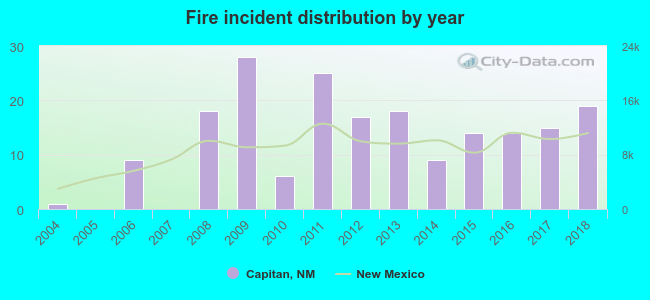 Based on the data from the years 2004 - 2018 the average number of fire incidents per year is 13. The highest number of fires - 28 took place in 2009, and the least - 0 in 2005. The data has a growing trend.
 19.2% incidents where reported in the morning and 80.8% in the evening. The most fires (19.2%) took place on Friday, and the least (8.8%) on Wednesday.
 Based on the 193 incident reports from years 2004 - 2018 most fires (15.0%) took place during July, and the least (3.6%) in August.
 Out of all 236 cases reported during the years 2004 - 2018, the most belonged to the categories: Fire (81.8%), Rescue & EMS (8.9%), and Overpressure Rupture (5.5%).
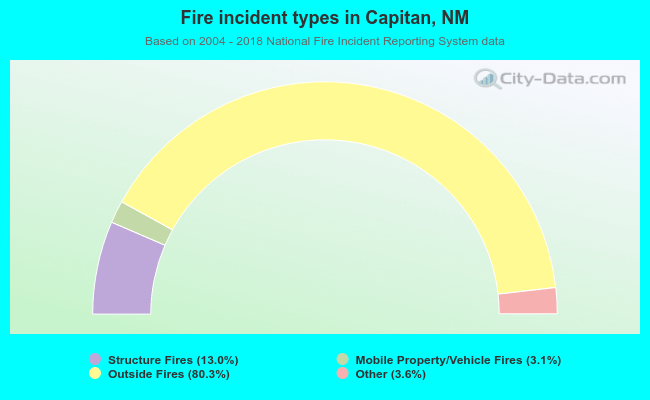 When looking into fire subcategories, the most reports belonged to: Outside Fires (80.3%), and Structure Fires (13.0%).