| Fire incidents reported |
|---|
| Sreet name | Count |
|---|
| OLD COUNTRY ROAD | 38 | | GLEN COVE ROAD | 36 | | OLD COUNTRY RD | 30 | | VOICE ROAD | 20 | | GLENCOVE RD | 12 | | NORTHERN STATE PKWY E/B | 12 | | BROADWAY | 10 | | WESTBURY AVE | 10 | | ATLANTIC AVE | 8 | | MEADOWBROOK STATE PKWY | 8 | | NORTHERN STATE PKWY | 8 | | NORTHERN STATE PKWY EB | 8 | | WESTBURY AVE | 8 | | CHERRY LA | 6 | | MEADOWBROOK PKWY | 6 | | VOICE RD | 6 | | 2 WESTBURY AVE | 4 | | 246 VOICE ROAD | 4 | | 8TH ST | 4 | | ASPINWALL ST | 4 | | CURTIS | 4 | | GARDEN AVE | 4 | | GLEN COVE RD | 4 | | MINEOLA AVE | 4 | | SOUTHVIEW CT | 4 |
| | | Fire incidents reported |
|---|
| Sreet name | Count |
|---|
| 1 OLD COUNTRY ROAD | 2 | | 11 SICARDI PL | 2 | | 12 GARSON ROAD | 2 | | 12TH ST | 2 | | 137 OLD COUNTRY ROAD | 2 | | 179 OLD COUNTRY ROAD | 2 | | 180 GLEN COVE ROAD | 2 | | 195 OLD COUNTRY ROAD | 2 | | 203 OLD COUNTRY ROAD | 2 | | 21 GARDEN AVE | 2 | | 211 OLD COUNTRY ROAD | 2 | | 217 GLEN COVE ROAD | 2 | | 223 VOICE ROAD | 2 | | 231 GLEN COVE ROAD | 2 | | 241 RUSHMORE AVE | 2 | | 248 GLEN COVE AVE | 2 | | 255 GLEN COVE ROAD | 2 | | 255 JAMAICA BLVD | 2 | | 264 MALLARD ROAD | 2 | | 277 WRIGHT AVE | 2 | | 319 RUSHMORE AVE | 2 | | 357 OLD COUNTRY ROAD | 2 | | 40 VOICE ROAD | 2 | | 43 OLD COUNTRY ROAD | 2 | | 475 ROSLYN AVE | 2 |
|
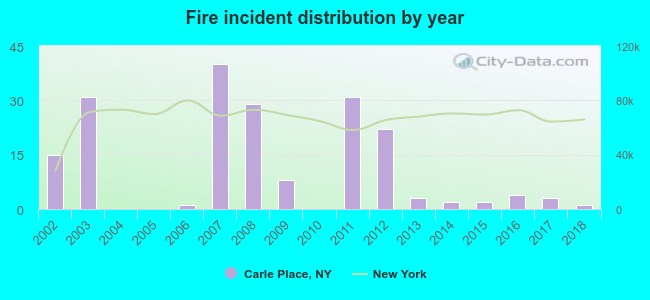 According to the data from the years 2002 - 2018 the average number of fire incidents per year is 11. The highest number of fires - 40 took place in 2007, and the least - 0 in 2004. The data has a dropping trend.
 28.1% incidents where reported in the morning and 71.9% in the evening. The most fires (16.7%) took place on Friday, and the least (11.5%) on Sunday.
 Based on the 192 fires from years 2002 - 2018 most fires (13.5%) took place during March, and the least (5.2%) in October.
 Out of all 3,921 cases reported during the years 2002 - 2018, the most belonged to the categories: Rescue & EMS (49.8%), False Alarm (28.2%), and Hazardous Condition (9.7%).
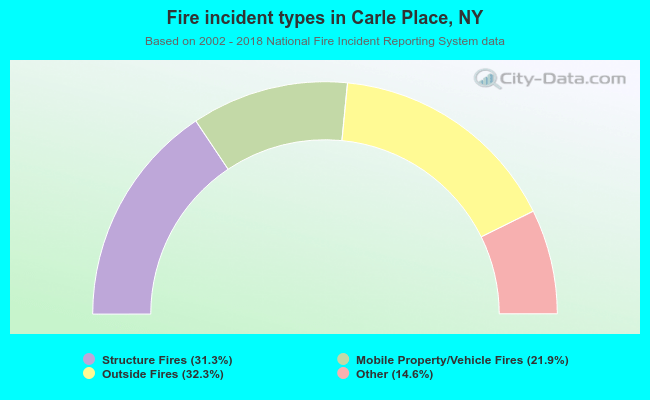 When looking into fire subcategories, the most incidents belonged to: Outside Fires (32.3%), and Structure Fires (31.3%).