| Fire incidents reported |
|---|
| Sreet name | Count |
|---|
| SHARP STREET | 8 | | VERNON RD | 8 | | CLAY CIRCLE | 6 | | SAND CREEK | 6 | | 211 LEE ST | 4 | | 239 SHARP ST | 4 | | 4TH STREET | 4 | | 541 OAK HILLS | 4 | | BOAT CLUB RD | 4 | | CARTWRIGHT | 4 | | CENTRAL STREET | 4 | | CLAY CIR | 4 | | DAVIS ACRES | 4 | | DAVIS ACRES RD | 4 | | DENISON DAM | 4 | | DENISON ST | 4 | | DOGWOOD LN | 4 | | GREEN OAKS | 4 | | OAK ST | 4 | | RACETRACK RD | 4 | | RED RIVER CITY | 4 | | RED RIVER CITY RD | 4 | | SANDCREEK AND WILLIFA WOODS RD | 4 | | SANDCREEK RD | 4 | | WEST BURNS RUN | 4 |
| | | Fire incidents reported |
|---|
| Sreet name | Count |
|---|
| WILLAFA WOODS RD | 4 | | WILLIFA WOODS ROAD | 4 | | $TH AND COLBERT | 2 | | 10 TROUT DR | 2 | | 102 SOUTH ST | 2 | | 104 OAK ST | 2 | | 109 VERNON | 2 | | 110 TROUT STREET | 2 | | 113 3RD ST | 2 | | 117 VERNON RD | 2 | | 12 ELM ST | 2 | | 122 NICHOLS | 2 | | 123 FAMILY LANE | 2 | | 1242 BOAT CLUB RD | 2 | | 128 TROUT DRIVE | 2 | | 130 CEDER | 2 | | 138 TROUTE DR | 2 | | 141 EAST ST | 2 | | 1466 SAND CREEK RD | 2 | | 1467 SAND CREEK RD | 2 | | 171 EAST STREET | 2 | | 177 DOGWOOD LN | 2 | | 177 HODGE LANE | 2 | | 177 HODGE RD | 2 | | |
|
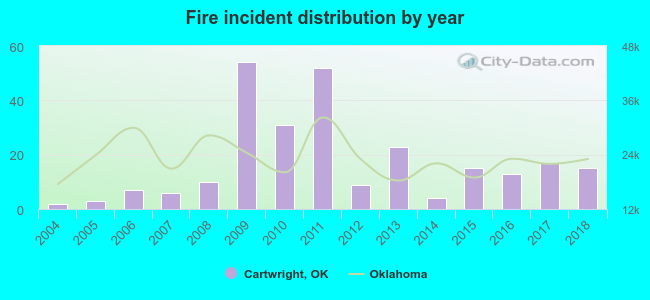 According to the data from the years 2004 - 2018 the average number of fire incidents per year is 17. The highest number of reported fire incidents - 54 took place in 2009, and the least - 2 in 2004. The data has a growing trend.
 36.0% incidents where reported in the morning and 64.0% in the evening. The most fires (17.2%) took place on Friday, and the least (9.6%) on Tuesday.
 According to the 261 reports from years 2004 - 2018 most fires (14.9%) took place during February, and the least (2.7%) in May.
 Out of all 317 cases reported during the years 2004 - 2018, the most belonged to the categories: Fire (82.3%), Hazardous Condition (7.3%), and Overpressure Rupture (6.3%).
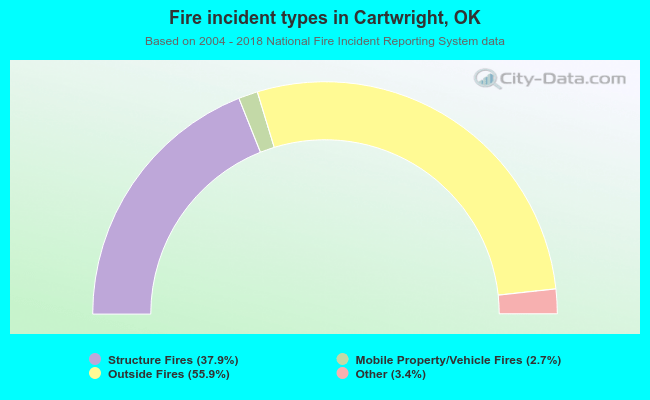 When looking into fire subcategories, the most incidents belonged to: Outside Fires (55.9%), and Structure Fires (37.9%).