Cass Lake: Fire Incidents, Minnesota (MN)
Where are fire incidents reported in Cass Lake, MN
Something went wrong! Please refresh the page.
|
| |||||||||||||||||||||||||||||||||||||||||||||||||||||||||||||||||||||||||||||||||||||||||||||||||||||||||||||
| Other | 119 | |||||||||||||||||||||||||||||||||||||||||||||||||||||||||||||||||||||||||||||||||||||||||||||||||||||||||||||
2009 - 2018 National Fire Incident Reporting System (NFIRS) incidents
- Incident types reported to NFIRS in Cass Lake, MN
- 44165.0%Fire
- 598.7%Hazardous Condition
- 527.7%Rescue & EMS
- 517.5%Good Intent Call
- 405.9%False Alarm
- 345.0%Service Call
- 10.1%Special Incident
- Fire incident types reported to NFIRS in Cass Lake, MN
- 18642.2%Structure Fires
- 17439.5%Outside Fires
- 5512.5%Mobile Property/Vehicle Fires
- 265.9%Other
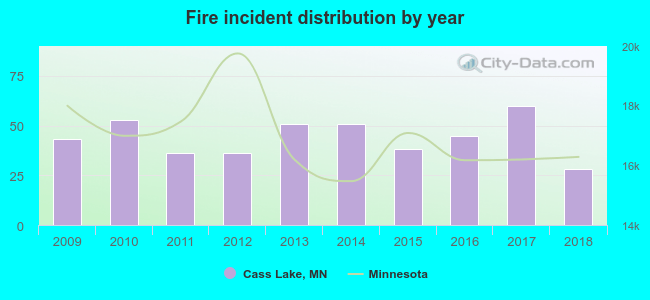 Based on the data from the years 2009 - 2018 the average number of fires per year is 44. The highest number of fire incidents - 60 took place in 2017, and the least - 28 in 2018. The data has a dropping trend.
 32.7% incidents where reported in the morning and 67.3% in the evening. The most fires (15.0%) took place on Friday, and the least (12.7%) on Thursday.
 Based on the 441 fires from years 2009 - 2018 most fires (17.2%) took place during May, and the least (4.5%) in February.
 Out of all 678 cases reported during the years 2009 - 2018, the most belonged to the categories: Fire (65.0%), Rescue & EMS (8.7%), and Overpressure Rupture (7.7%).
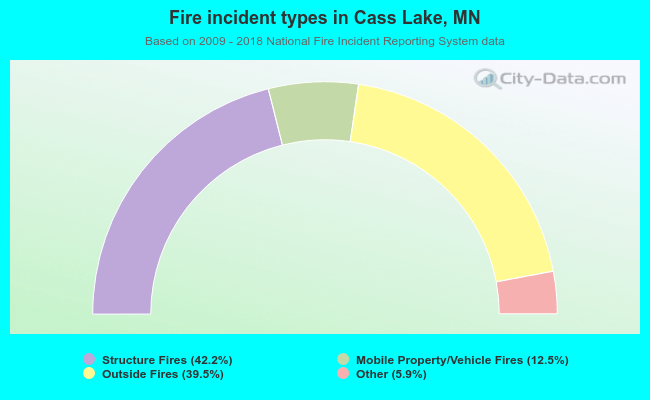 When looking into fire subcategories, the most incidents belonged to: Structure Fires (42.2%), and Outside Fires (39.5%).