| Fire incidents reported |
|---|
| Sreet name | Count |
|---|
| I 94 | 10 | | INTERSTATE 94 | 10 | | I94 | 8 | | CASSELTON AIRPORT | 6 | | HIGHWAY 18 | 6 | | HYW 18 | 6 | | I 94 MM 334 | 6 | | 3549 153 AVE SE | 4 | | 37TH ST | 4 | | 4TH ST | 4 | | AIRPORT | 4 | | FRONT STREET | 4 | | 1/4 MILE EAST OF 158 AVE SE | 2 | | 10 TH AVE | 2 | | 1002 2ST S | 2 | | 1002 FRONT ST | 2 | | 121 13TH AVEN | 2 | | 121 5TH AVE N | 2 | | 131 6 AVE N | 2 | | 131 6 AVE N | 2 | | 132 5 TH AVE N | 2 | | 141 2ND ST NORTH | 2 | | 141 1 ST ST N | 2 | | 15247 47TH SE | 2 | | 15257 38TH ST SE | 2 |
| | | Fire incidents reported |
|---|
| Sreet name | Count |
|---|
| 15261 36TH ST | 2 | | 153 AVE | 2 | | 153 R AVE | 2 | | 154 AVE | 2 | | 154 AVE SE 36TH ST | 2 | | 155 12 AVE 37TH ST SE | 2 | | 155 AVE SE ON HWY 18 | 2 | | 15556 37TH ST SE | 2 | | 157 AVE 31 ST | 2 | | 157 AVE 36 ST SE | 2 | | 157 AVE SE FRONT STREET CASS | 2 | | 15750 35 1/2 ST | 2 | | 158 AVE | 2 | | 15854 36TH ST SE | 2 | | 160 AVE 29TH ST SE | 2 | | 161 ST AVE SE AT HY 10 | 2 | | 16122 35TH ST SE | 2 | | 1630 1 AVE S | 2 | | 16666 37TH STSE | 2 | | 18 ST 43RD ST SOUTH | 2 | | 1950 HEARTLAND AVE | 2 | | 19556 37TH ST SE | 2 | | 2 AVE SOUTH | 2 | | 2050 GOV DRIVE | 2 | | |
|
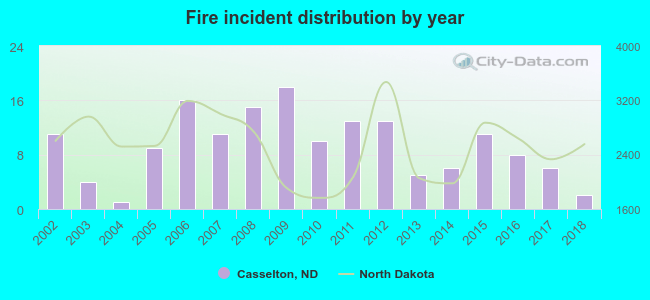 According to the data from the years 2002 - 2018 the average number of fires per year is 9. The highest number of fire incidents - 18 took place in 2009, and the least - 1 in 2004. The data has a declining trend.
 29.6% incidents where reported in the morning and 70.4% in the evening. The most fires (21.4%) took place on Saturday, and the least (8.8%) on Thursday.
 Based on the 159 incident reports from years 2002 - 2018 most fires (15.1%) took place during October, and the least (0.6%) in January.
 Out of all 390 cases reported during the years 2002 - 2018, the most belonged to the categories: Fire (40.8%), Rescue & EMS (19.0%), and Overpressure Rupture (15.6%).
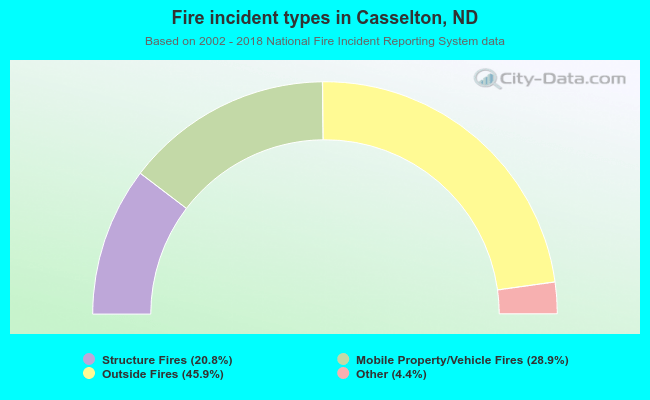 When looking into fire subcategories, the most incidents belonged to: Outside Fires (45.9%), and Mobile Property/Vehicle Fires (28.9%).