Cayuga: Fire Incidents, Indiana (IN)
Where are fire incidents reported in Cayuga, IN
Something went wrong! Please refresh the page.
|
| |||||||||||||||||||||||||||||||||||||||||||||||||||||||||||||||||||||||||||||||||||||||||||||||||||||||||||||
2003 - 2018 National Fire Incident Reporting System (NFIRS) incidents
- Incident types reported to NFIRS in Cayuga, IN
- 51060.6%Rescue & EMS
- 23127.4%Fire
- 445.2%Good Intent Call
- 323.8%Hazardous Condition
- 111.3%Service Call
- 91.1%False Alarm
- 30.4%Severe Weather
- 20.2%Special Incident
- Fire incident types reported to NFIRS in Cayuga, IN
- 10445.0%Outside Fires
- 9440.7%Structure Fires
- 2611.3%Mobile Property/Vehicle Fires
- 73.0%Other
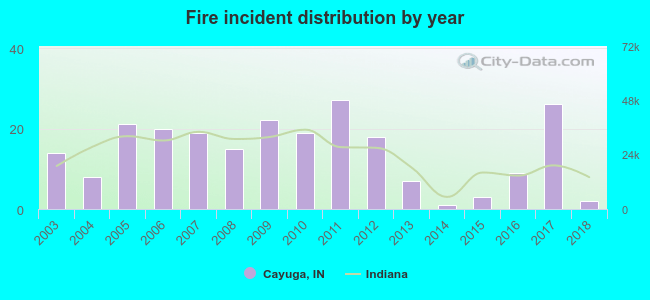 According to the data from the years 2003 - 2018 the average number of fire incidents per year is 14. The highest number of reported fires - 27 took place in 2011, and the least - 1 in 2014. The data has a dropping trend.
 27.3% incidents where reported in the morning and 72.7% in the evening. The most fires (18.6%) took place on Tuesday, and the least (10.4%) on Wednesday.
 Based on the 231 fire incident reports from years 2003 - 2018 most fires (13.4%) took place during March, and the least (3.9%) in August.
 Out of all 842 cases reported during the years 2003 - 2018, the most belonged to the categories: Overpressure Rupture (60.6%), Fire (27.4%), and Service Call (5.2%).
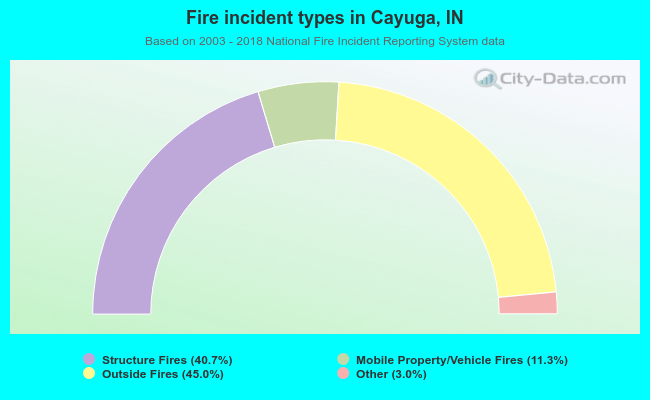 When looking into fire subcategories, the most incidents belonged to: Outside Fires (45.0%), and Structure Fires (40.7%).