| Fire incidents reported |
|---|
| Sreet name | Count |
|---|
| NELSON RD | 12 | | EAST LAKE RD | 10 | | GORGE RD | 10 | | POMPEY HOLLOW RD | 10 | | WEST LAKE RD | 10 | | LAKE RD | 8 | | ROUTE 20 RD | 8 | | ROUTE 92 RD | 8 | | 24 NELSON STREET | 6 | | ALBANY ST | 6 | | BINGLEY RD | 6 | | MAPLE RD | 6 | | MUTTON HILL ROAD | 6 | | ROUTE 92 | 6 | | 2777 ROUTE 20 | 4 | | 4065 NELSON ROAD | 4 | | CARRIAGE LN | 4 | | CARRY HILL RD | 4 | | CODY RD | 4 | | EAST LAKE ROAD | 4 | | FALLS RD | 4 | | LINCKLAEN ST | 4 | | MORAINE RD | 4 | | MOSELEY RD | 4 | | RIDGE ROAD | 4 |
| | | Fire incidents reported |
|---|
| Sreet name | Count |
|---|
| RIPPLETON CROSS ROAD | 4 | | ROUTE 13 RT | 4 | | ROUTE 20 EAST | 4 | | ROUTE 20 NELSON | 4 | | SULLIVAN ST | 4 | | TEMPERANCE HILL RD | 4 | | TEMPERANCE RD | 4 | | 13 HURD STREET | 2 | | 1400 EAST VIEW DRIVE | 2 | | 16 1/2 CENTER STREET | 2 | | 16 EMERY STREET | 2 | | 1659 NORTH LAKE ROAD | 2 | | 1702 ROUTE 20 | 2 | | 1741 STANLEY ROAD | 2 | | 18 BURR STREET | 2 | | 1812 ROUTE 20 | 2 | | 1922 STANLEY ROAD | 2 | | 20 CARRIAGE HOUSE LANE | 2 | | 2001 PRESTON ROAD | 2 | | 2287 MAPLE AVENUE | 2 | | 24 WILLIAMS STREET | 2 | | 2415 FENNER ROAD | 2 | | 2565 FENNER ROAD | 2 | | 27 CHENANGO STREET | 2 | | |
|
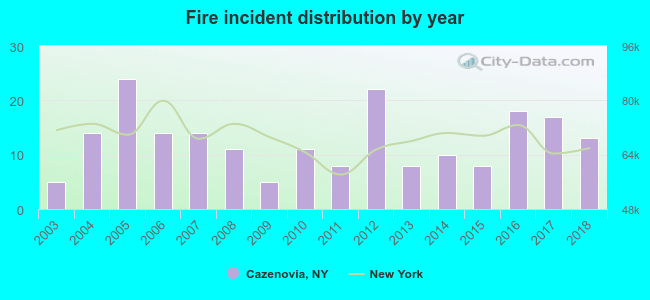 Based on the data from the years 2003 - 2018 the average number of fire incidents per year is 13. The highest number of fires - 24 took place in 2005, and the least - 5 in 2003. The data has an increasing trend.
 32.7% incidents where reported in the morning and 67.3% in the evening. The most fires (19.3%) took place on Saturday, and the least (10.4%) on Tuesday.
 Based on the 202 fire incidents from years 2003 - 2018 most fires (14.4%) took place during March, and the least (2.0%) in August.
 Out of all 2,435 cases reported during the years 2003 - 2018, the most belonged to the categories: Overpressure Rupture (59.9%), Service Call (13.3%), and Fire (8.3%).
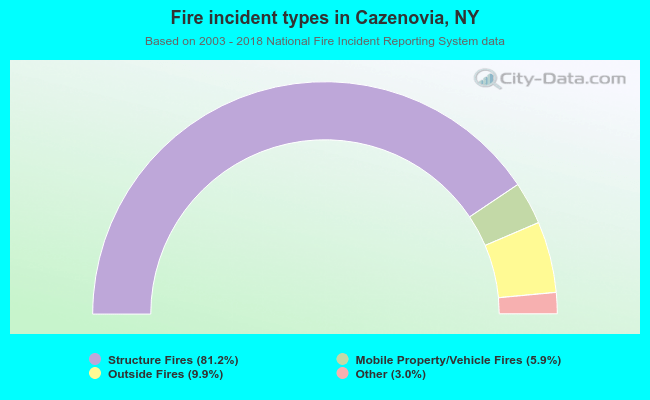 When looking into fire subcategories, the most reports belonged to: Structure Fires (81.2%), and Outside Fires (9.9%).