| Fire incidents reported |
|---|
| Sreet name | Count |
|---|
| 24 FWY | 44 | | MAXEY RD | 36 | | I24 | 26 | | EDD ROSS RD | 22 | | 41-A HWY | 14 | | BUZZARD CREEK RD | 14 | | TURNERSVILLE RD | 14 | | HEADS CHURCH RD | 12 | | KINNEYS RD | 12 | | GLEN RAVEN RD | 10 | | WANDALAND RD | 10 | | BURGESS GOWER RD | 8 | | GOODMAN LANE | 8 | | JAMES STONE RD | 8 | | MUDCAT RD | 8 | | WEST STROUDVILLE RD | 8 | | ATKINS RD | 6 | | BUZZARD CREEK | 6 | | MAGGIE FARMER RD | 6 | | RIDGE RD | 6 | | SANDY SPRINGS RD | 6 | | STROUDSVILLE RD | 6 | | US41A HWY | 6 | | WILSON RD | 6 | | 41 | 4 |
| | | Fire incidents reported |
|---|
| Sreet name | Count |
|---|
| BALTHROP RD | 4 | | CARTER ROAD | 4 | | CATHOLIC CHURCH RD | 4 | | DRAKE RD | 4 | | DRAKE ROAD | 4 | | FLEWELLYN RD | 4 | | GAUSE RD | 4 | | MAIN STRE | 4 | | MAXEY ROAD | 4 | | OLD WASHINGTON | 4 | | PEARL SEAY RD | 4 | | RAIL ROAD ST | 4 | | TOBY DARDEN RD | 4 | | WALTER HEAD RD | 4 | | 114 RAIL ROAD ST | 2 | | 161 HIGH | 2 | | 24 | 2 | | 41 A HWY | 2 | | 41 HWY | 2 | | 41-A | 2 | | 41NORTH GARRETT ROAD | 2 | | AIRPORT ROAD | 2 | | ANDERSON RANCH ROAD | 2 | | ANDERSON RD | 2 | | ASHBURN ROAD | 2 |
|
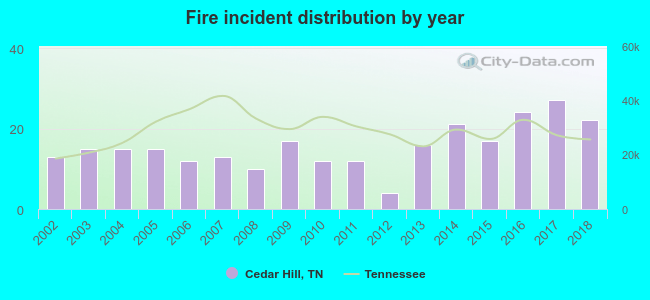 Based on the data from the years 2002 - 2018 the average number of fires per year is 16. The highest number of reported fires - 27 took place in 2017, and the least - 4 in 2012. The data has an increasing trend.
 31.7% incidents where reported in the morning and 68.3% in the evening. The most fires (17.0%) took place on Saturday, and the least (11.3%) on Wednesday.
 According to the 265 incident reports from years 2002 - 2018 most fires (13.6%) took place during February, and the least (3.0%) in July.
 Out of all 1,256 cases reported during the years 2002 - 2018, the most belonged to the categories: Rescue & EMS (48.5%), Fire (21.1%), and Good Intent Call (14.1%).
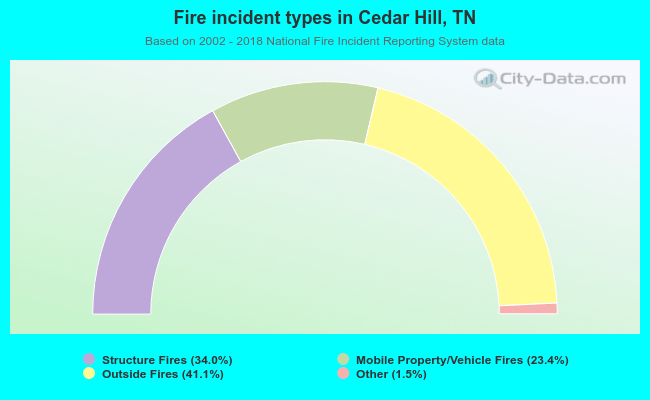 When looking into fire subcategories, the most incidents belonged to: Outside Fires (41.1%), and Structure Fires (34.0%).