| Fire incidents reported |
|---|
| Sreet name | Count |
|---|
| MAIN ST | 100 | | CEDARVILLE RD | 84 | | NEWPORT RD | 38 | | SCHAFFER AVE | 30 | | MAPLE AVE | 28 | | RAMAH RD | 26 | | FACTORY RD | 20 | | HOGBIN RD | 20 | | LUMMISTOWN RD | 18 | | SAW MILL RD | 14 | | NORRIS AVE | 12 | | SAYRES NECK RD | 12 | | BAY POINT RD | 10 | | FRANKLIN ST | 10 | | MULFORD AVE | 10 | | NORTH AVE | 10 | | CEDARBROOK LN | 8 | | CEDAR BROOK LN | 6 | | EAST AVE | 6 | | HENRY AVE | 6 | | LEXINGTON AVE | 6 | | NEW RD | 6 | | WILBUR DAVIS RD | 6 | | WILSON AVE | 6 | | BUCKSHUTEM RD | 4 |
| | | Fire incidents reported |
|---|
| Sreet name | Count |
|---|
| CARPENTER ST | 4 | | CENTRAL AVE | 4 | | FOLSON AVE | 4 | | LEE AVE | 4 | | NARDELLI DR | 4 | | PARIS RD | 4 | | SAWMILL RD | 4 | | SHAWS MILL RD | 4 | | BACK RD | 2 | | BAY POINT | 2 | | BETA LN | 2 | | BRIDGETON FAIRTON RD | 2 | | BRIDGETON MILLVILLE PIKE | 2 | | CARPENTER AVE | 2 | | CEDARVILLE | 2 | | EDGEWOOD AVE | 2 | | FAIRTON CEDARVILLE ROAD | 2 | | FAIRTON MILLVILLE RD | 2 | | GAGE AVE | 2 | | GARFIELD AVE | 2 | | GEORGE ST | 2 | | GRANT AVE | 2 | | HENRY AV | 2 | | HENRY ST | 2 | | HOGBIN RD | 2 |
|
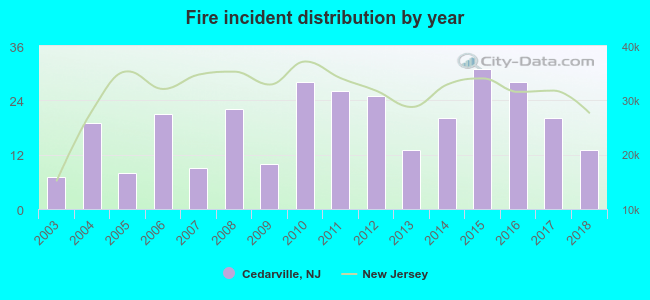 According to the data from the years 2003 - 2018 the average number of fire incidents per year is 19. The highest number of fires - 31 took place in 2015, and the least - 7 in 2003. The data has a rising trend.
 25.7% incidents where reported in the morning and 74.3% in the evening. The most fires (20.3%) took place on Friday, and the least (10.7%) on Monday.
 According to the 300 fire incident reports from years 2003 - 2018 most fires (13.7%) took place during January, and the least (3.7%) in October.
 Out of all 874 cases reported during the years 2003 - 2018, the most belonged to the categories: Rescue & EMS (45.1%), Fire (34.3%), and Service Call (6.1%).
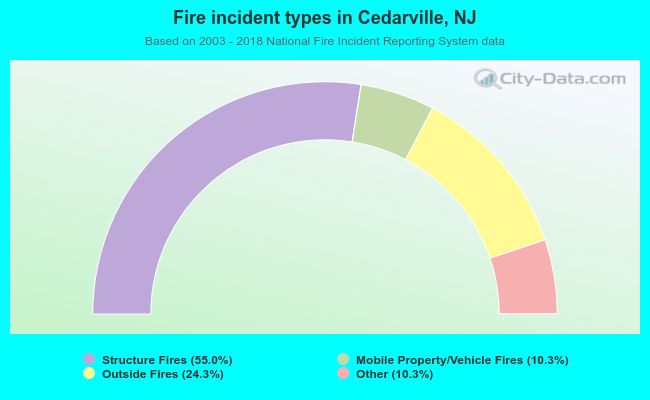 When looking into fire subcategories, the most reports belonged to: Structure Fires (55.0%), and Outside Fires (24.3%).