| Fire incidents reported |
|---|
| Sreet name | Count |
|---|
| OLD NATIONAL PIKE | 8 | | LOWHILL RD | 6 | | 77 RT | 4 | | ARCH | 4 | | ARMSTRONG RD | 4 | | BROWN HILL RD | 4 | | CHASE RD | 4 | | ERIE ST | 4 | | ERIE ST | 4 | | FISH FLATS RD | 4 | | GARLAND ST | 4 | | HANCOCK RD | 4 | | MAGEETOWN RD | 4 | | POST RIDGE RD | 4 | | RICHEYVILLE RD | 4 | | RIDGE RD | 4 | | ST HWY 89 | 4 | | ST RT 8 HWY | 4 | | STATE HWY 77 | 4 | | 16612 ST HIGHWAY 8 | 2 | | 17824 ST HIGHWAY 8 | 2 | | 18376 ST HIGHWAY 89 | 2 | | 18727 ERIE ST | 2 | | 31 VESTA 7 ROAD | 2 | | 3RD ST | 2 |
| | | Fire incidents reported |
|---|
| Sreet name | Count |
|---|
| 42717 BUELLS CORNERS RD | 2 | | 43 TPKE | 2 | | 43218 GILSON RIDGE RD | 2 | | 531 OLD NATIONAL PIKE | 2 | | 6TH ST | 2 | | 77 HWY | 2 | | 8 HWY | 2 | | 89 RT | 2 | | 935 OLD NATIONAL PIKE | 2 | | 940 OLD NATIONAL PIKE | 2 | | ARCH ST | 2 | | ARMSTRONG RD | 2 | | ARMSTRONG RDS | 2 | | ASH ST | 2 | | BANCROFT RD | 2 | | BANCROFT ROAD | 2 | | BLACK WALNUT FARM ROAD | 2 | | BRIMSTONE RD | 2 | | BROWN HILL RD | 2 | | BUELLS CORNERS RD | 2 | | BUELLS CORNERS ROAD | 2 | | CENTERVILLE RD | 2 | | CENTERVILLE RD | 2 | | CLEMMETS RD | 2 | | CLEMMETS RD. | 2 |
|
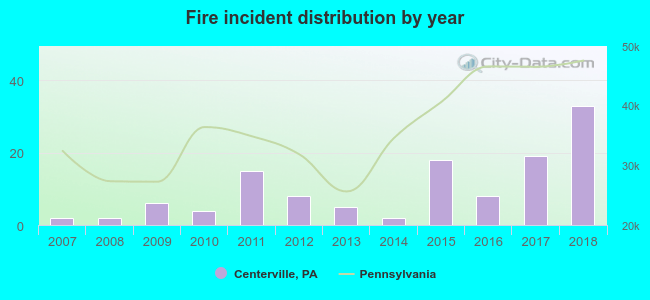 Based on the data from the years 2007 - 2018 the average number of fires per year is 10. The highest number of reported fires - 33 took place in 2018, and the least - 2 in 2007. The data has a rising trend.
 36.1% incidents where reported in the morning and 63.9% in the evening. The most fires (18.9%) took place on Wednesday, and the least (9.0%) on Thursday.
 According to the 122 fire incident reports from years 2007 - 2018 most fires (16.4%) took place during March, and the least (0.0%) in July.
 Out of all 434 cases reported during the years 2007 - 2018, the most belonged to the categories: Overpressure Rupture (32.7%), Fire (28.1%), and Hazardous Condition (18.9%).
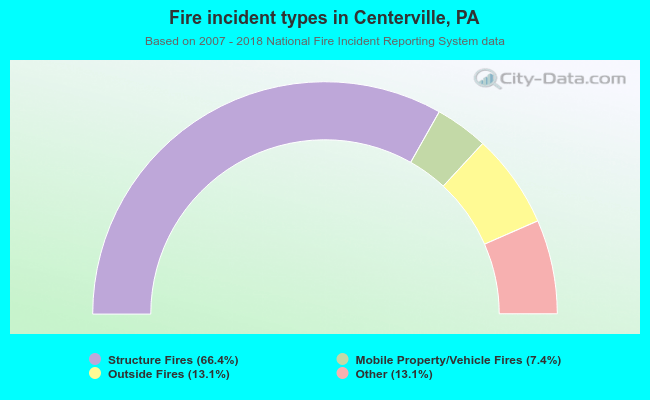 When looking into fire subcategories, the most reports belonged to: Structure Fires (66.4%), and Outside Fires (13.1%).