| Fire incidents reported |
|---|
| Sreet name | Count |
|---|
| HWY 100 | 36 | | 100 HWY | 18 | | HWY 50 E | 12 | | 50 HWY | 10 | | HIGHWAY 100 | 8 | | SKYVIEW DR | 8 | | TWOMEY RD | 8 | | 1517 HWY 50 EAST | 6 | | HWY 100 WEST | 6 | | HWY 50 | 6 | | SWAN CREEK RD | 6 | | 104 MOSS SPRING HOLLOW RD | 4 | | 201 GRAYS BEND RD | 4 | | 48 HWY | 4 | | 584 HWY 100 | 4 | | COLUMBIA AVE | 4 | | EAST POINT DRIVE | 4 | | FAIRFIELD DR | 4 | | GRAYS BEND RD | 4 | | GREENHILL DR | 4 | | GRINDERS SWITCH RD | 4 | | HIGHWAY 48 SOUTH | 4 | | HWY 48 | 4 | | HWY 50 EAST | 4 | | HWY 50 WEST | 4 |
| | | Fire incidents reported |
|---|
| Sreet name | Count |
|---|
| HWY 50 WEST LOOP | 4 | | INDUSTRIAL RD. | 4 | | JAMIE DR | 4 | | JAMIE DRIVE | 4 | | MORGAN CREEK ROAD | 4 | | MOSS SPRING HOLLOW RD | 4 | | MOSS SPRING HOLLOW RD | 4 | | PARKER AV | 4 | | PARKER ST | 4 | | VALLEY DR | 4 | | WEST BEAVERDAM RD | 4 | | WHITSON BEND ROAD | 4 | | 100 HWY 100 | 2 | | 100 LINDEN RD | 2 | | 100 OAK AV | 2 | | 1014 OLD STATE ROUTE 50 | 2 | | 103 RIVERSIDE DR | 2 | | 105 E WARD AV | 2 | | 107 EAST WARD ST | 2 | | 1077 HWY 100 | 2 | | 1149 E BEAVERDAM RD | 2 | | 121 PERRY ST | 2 | | 1240 HIGHWAY 438 | 2 | | 1307 WEST HALEYS CRK RD | 2 | | |
|
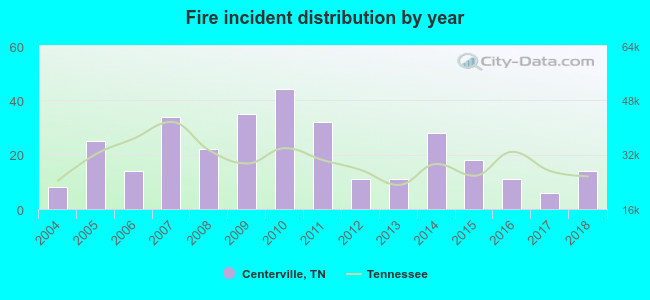 Based on the data from the years 2004 - 2018 the average number of fires per year is 21. The highest number of reported fires - 44 took place in 2010, and the least - 6 in 2017. The data has an increasing trend.
 31.3% incidents where reported in the morning and 68.7% in the evening. The most fires (17.9%) took place on Saturday, and the least (11.2%) on Tuesday.
 According to the 313 incident reports from years 2004 - 2018 most fires (15.3%) took place during February, and the least (3.8%) in June.
 Out of all 559 cases reported during the years 2004 - 2018, the most belonged to the categories: Fire (56.0%), Overpressure Rupture (29.0%), and Rescue & EMS (6.8%).
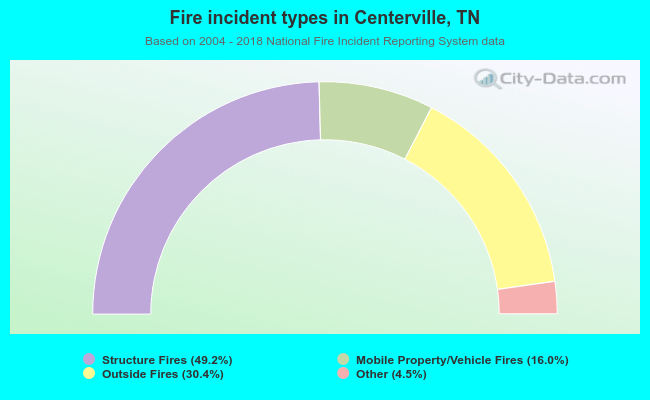 When looking into fire subcategories, the most incidents belonged to: Structure Fires (49.2%), and Outside Fires (30.4%).